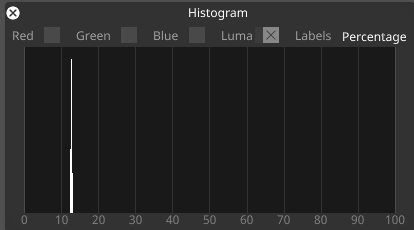
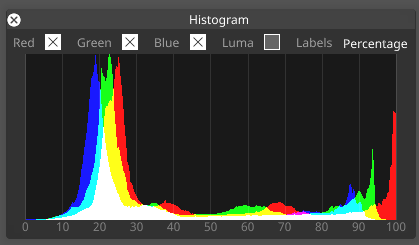
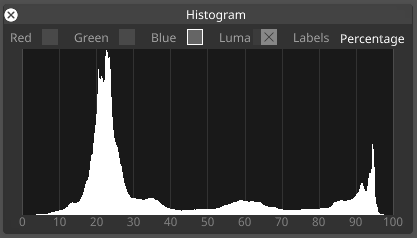
The histogram shows the number of pixels that are a certain value.
Histograms are mainly used to verify the end-to-end signal of an image. This is particularly useful when there is a known value in the content, and we want to make sure that it remains at that value throughout the signal chain.
A histogram can be used to verify the signal chain at these points:
-
On a Video Input within the Video Input patch Editor- After capture into disguise and any layer stack modifications
- The feed output - after being transformed into the final 8- or 10-bit format going to the display
-
Open the Feed Output window by clicking on Feed in the dashboard
-
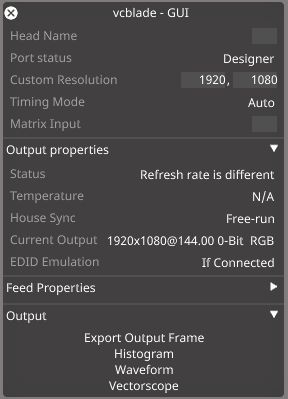
Right click on the border of an output to open the Output Properties window
-
Click on Histogram in the Output tab
The histogram can take its value either from the red, green or blue channels, or from the combined luma value i.e. brightness:
-
The horizontal axis shows the value
-
The vertical axis is the percentage of pixels at that value.
-
The left side of the histogram is the lowest value (e.g. black)
-
The right hand side is the highest value (e.g. white).
-
A peak means that the majority of the image is at that value
The horizontal axis can be :
-
Unlabeled
-
Labeled by raw value (0…255 for 8-bit images, 0-1023 for 10-bit images, 0..1 for floating point images)
-
A percentage from 0 to 100
-
A nit value on the Perceptual Quanitizer (PQ) scale – which is common for HDR outputs