Histogram
Overivew
Section titled “Overivew”The histogram shows the number of pixels that are a certain value.
Histograms are mainly used to verify the end-to-end signal of an image. This is particularly useful when there is a known value in the content, and we want to make sure that it remains at that value throughout the signal chain.
Opening the Histogram
Section titled “Opening the Histogram”A histogram can be used to verify the signal chain at these points:
- On a Video Input within the Video Input patch Editor- After capture into Disguise and any layer stack modifications.
- The feed output - after being transformed into the final 8- or 10-bit format going to the display.
- Open the Feed Output window by clicking on Feed in the dashboard
- Right-click on the border of an output to open the Output Properties window.
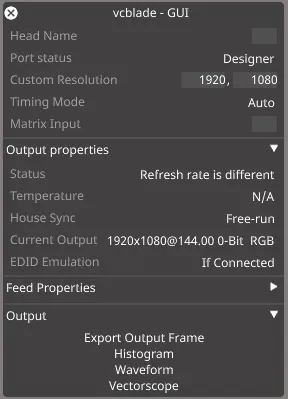
- Click on Histogram in the Output tab.
Understanding the Histogram
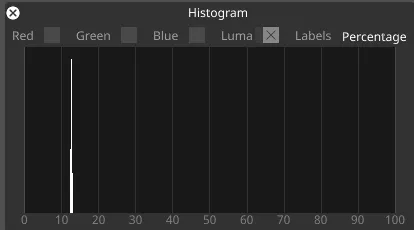
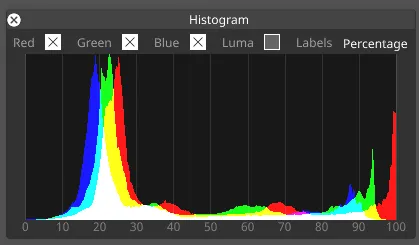
Section titled “Understanding the Histogram”The histogram can take its value either from the red, green or blue channels, or from the combined luma value i.e. brightness:
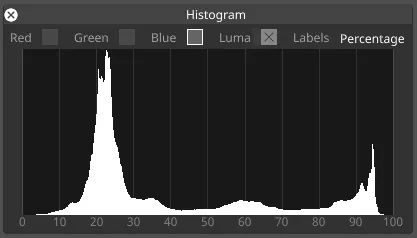
- The horizontal axis shows the value
- The vertical axis is the percentage of pixels at that value.
- The left side of the histogram is the lowest value (e.g. black)
- The right hand side is the highest value (e.g. white).
- A peak means that the majority of the image is at that value
The horizontal axis can be :
- Unlabelled
- Labeled by raw value (0…255 for 8-bit images, 0-1023 for 10-bit images, 0..1 for floating point images).
- A percentage from 0 to 100.
- A nit value on the Perceptual Quanitizer (PQ) scale – which is common for HDR outputs.