Calibration Errors
The process of calibrating a camera or projector requires a set of input data and a model that expresses the geometry and physics. This model is a set of known equations that are determined by unknown parameters. For projectors or cameras the model usually involves a 3D position and orientation, as well as lens parameters such as focal length, lens shift or distortion coefficients.
During the calibration process suitable model parameters are estimated, based on the input data observations.
Calibration errors are a measure of how well the estimated model parameters conform to the input data.
Calibration in Disguise typically involves several pairs of 2D and 3D points. The source of these point pairs can be for example:
- manual input (2D lineup position in QuickCal)
- automatic detection (2D blob positions in OmniCal or xR)
- existing file data (3D mesh vertices used in QuickCal)
- reconstructed 3D points (based on automatically detected 2D blobs in OmniCal or xR)
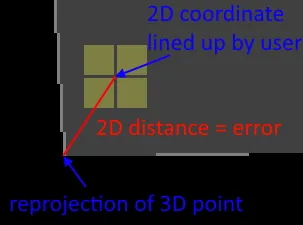
Error measurements are often calculated as Reprojection Errors: the input 3D points are projected back onto the projector (or camera) image using the equations and parameters of the calibrated model.
The resulting 2D points are compared against the original input 2D points. The difference between them (usually the absolute 2D distance) is used for the error calculation. The total error is aggregated over all point pairs in different ways (see below).
The unit for these reprojection errors is usually in pixels.
Lower error values are better.
Typically, a reprojection error below 1 pixel is desirable, although in some circumstances higher values can be acceptable. This is a judgement call that depends on the shape of the surface, what content is used, or the effective resolution that the content will be visible at on the projection surface. If the audience is far away, or the resolution is very high, then higher errors may not be noticeable.
In QuickCal it is more difficult to achieve true subpixel accuracy, since the user can only line up the 2D cursor at full pixel boundaries. This introduces systematic errors of up to a half pixel in either direction.
In OmniCal and xR, the 2D blobs are detected with sub-pixel accuracy due to the relative size of the blobs in the camera images.
There are several ways of calculating errors from the above-mentioned point differences:
Average or Mean absolute error (Avg)
Section titled “Average or Mean absolute error (Avg)”The average (or mean) error is simply the sum of absolute errors divided by the number of errors. The use of absolute values means that it cannot be negative. A value of 0 would be a perfect result. Individual differences have a proportional influence on the total average error. This makes it easy to understand and a good measure of success.
Root Mean Square error (RMSE)
Section titled “Root Mean Square error (RMSE)”The RMSE is the square root of the average of squared individual errors. It also cannot be negative, and a value of 0 would be a perfect result. Because the individual differences are squared, larger errors have a disproportionately large effect on the total RMSE. Consequently, RMSE is sensitive to outliers.
This is why OmniCal will remove any outliers from the data set before and between calibration steps. The RMS error is often used during the calibration itself to drive the process faster in the best “direction”. But it is also used at the end of a calibration as a measure of success.
In QuickCal, the RMS reprojection error is always calculated again after the calibration completes. For some algorithms, QuickCal also reports back the internal RMS error from the algorithm itself. In the UI this is shown as “rest”.
- It is possible for two different calibration input data sets to have the same average error, but different RMS errors.
- A calibration error is not always a guarantee for a successful calibration that is visually convincing. If there are only few input point pairs, then it is possible that redundant information or mistakes lead to unrealistic model parameters, despite low error values.
Calibration Error Visualisation
Section titled “Calibration Error Visualisation”In Designer different colours are used to give operators a clearer idea of what calibration errors mean.
Below is a list of colours used in QuickCal and OmniCal and the meaning they represent. The meaning depends if the error value is a total error like RMSE, or whether it is only for a single 2D/3D point pair from the input data set. Any error value is alway represented by a gradient between any of these colours, so a green yellow is better than pure yellow, which again is better than orange.
| Colour | Error | Meaning for RMSE | Meaning for Individual Point Pair |
|---|---|---|---|
| Low error (good quality) | Calibration was successful. | Good contribution to calibration. | |
| Medium-high error | Calibration quality is borderline acceptable. Need to make a visual judgement whether it looks good enough or not. | Potentially problematic contribution to calibration. If there too many point pairs like this, then overall calibration may not be good enough | |
| High error | Unacceptable quality | Bad contribution to calibration (a single bad point pair can make a calibration fail). QuickCal: operator should re-align or remove it. OmniCal: operator should aim to filter it out using outlier handling | |
| Not calibrated | Calibration failed.There were not enough 2D/3D input point pairs fo the selected algorithm. Input data was bad / inconsistent. | No contribution to calibration. OmniCal: rejected due to outlier handling. |