Hardware Playback Performance Capture
Introduction and Disclaimer
Section titled “Introduction and Disclaimer”This document specifies the method taken to determine the maximum video throughput of any given Disguise media server. It will no doubt become apparent that the environment created to find these figures better resembles laboratory conditions than a real production, and should therefore be thought of as theoretical maximums rather than practical ones.
The impact from the application of other software and hardware features is not explored in this suite of tests, nor do they take into consideration the discrete purposes of certain machines in the catalogue - ie: the generative capabilities of the GX range.
The goal of this test is to discover how many separate videos of a single codec can be played while maintaining a desired framerate. The test is identical for each Disguise media server to allow for direct comparison. Since different codecs stress the video playback pipeline in different ways, these tests will make it possible to determine potential strengths and weaknesses of each media server.
Project Requirements and Scope
Section titled “Project Requirements and Scope”The video playback pipeline in itself is host to a large amount of potential variables. A set of rules has been recorded to ensure that the tests are truly illustrative of what the product is capable of, as well as keeping the process as repeatable as possible. Some of these rules will eliminate variables that are hard to control, and others will ensure that the machine is being stressed adequately.
The project attached abides to these rules, which can be divided into categories of stage, timeline, feed, and hardware:
- The media server being tested must be run as an Actor with its GUI disabled.
- If the media server cannot be run as an Actor, minimum GUI elements should be present, and measurements are to be taken in the stage view
- The stage is to be kept as minimal as possible. No props or any other complex geometry.
- One LED screen per resolution tested and all layers directly mapped to that screen.
Timeline
Section titled “Timeline”- One codec tested per track.
- One unique video file per layer.
- Add one additional layer every two sections.
- Video layers must be set to Locked mode.
- The prefetcher must be moderated by making two sections per additional video.
- All screens must be assigned to an output on the Actor machine. The Director machine should be a Dedicated Director with no outputs assigned.
Hardware
Section titled “Hardware”- Actor machine should be genlocked across all outputs.
- If the media server being tested is VFC compatible, it must contain only DisplayPort or HDMI VFC cards.
- The Actor machine should have a physical display connected to at least one of the DisplayPort or HDMI outputs to aid in spotting frame drops. All other non-GUI outputs should be emulated to ensure all can be genlocked.
- If the media server features a RAID array, it must be in the same configuration as it would out of box. For example, the VX 4+ ships with a RAID 10 configuration, and so that is used for the test.
- All media servers must be using the latest version of their respective OS images with the correct, trusted GPU driver.
Parallel to the above restrictions runs the matter of codecs and video content, which have their own guidelines.
Other supported codecs were not included for the following reasons:
DXV: Similar, if sometimes slightly lighter, performance impact to HAP. Less popular than HAP due to lack of support for version 3.
HAP-Alpha: Identical performance impact and data rate to HAPQ, since both make use of a fourth channel.
Photo-JPEG: CPU-bound codecs are always at a disadvantage compared to their GPU processed counterparts. In the case of Photo-JPEG, the sacrifice made in order to play these files is disproportionate to the gain in quality when considered alongside Quicktime Animation.
The video content used for each codec was also given careful consideration - solid black frames would not do, but neither would full frames of animated colour noise. Content has been selected to produce a processing load and data rate that is on the heavy side of realistic, and to ensure this the following guidelines have been respected:
- Avoid using motion graphics with large blocks of unbroken hues. This is especially important for Quicktime Animation. Noisy gradients are suitable, real-life filmed content is preferred.
- The video should include lots of movement, like sweeping moves across the frame or quick cuts. Large steady moves are preferred as they can help the individual testing more easily assess playback smoothness. Sports footage is good for this - boardsports in particular.
- Although audio is not tested, all videos should include embedded audio when possible.
- All clips should each be a couple of minutes long.
- Content must be rendered at maximum quality for that codec - ie: spatial quality at 100 in Adobe Media Encoder.
- Content must be rendered in 30fps and 60fps at either Full HD (1920 x 1080) or 4K DCI (4096 x 2160) with 8-bit colour with the exception of DPX Sequence which is tested with content files with both 8-bit and 10-bit colour
- 4% colour noise should be added to the content to smooth out variable bit rates.

Bad: Motion graphics with large areas of one colour. This is especially problematic with Quicktime Animation and can lead to large fluctuations in data rate frame-to-frame.

Good: Additional colour noise. This breaks up the large patches and evens out, but is also likely to increase the data rate of the video.

Best: Real-life filmed content. In this example the motion of the ocean as a whole creates a good amount of natural noise, while the movement of the wave and the surfer is a good subject with which to track frame smoothness.
How Data Is Gathered
Section titled “How Data Is Gathered”The data gathered is the number of video layers playing back content before the machine starts dropping or missing frames in a 60Hz project. 60Hz is used because, as the highest conventional refresh rate available, each frame represents the smallest amount of time possible - 16.67ms per frame in this case - making it the hardest rate for the software to work at. Lower refresh rates can result in greater maximum performance from there being more time in a frame to do that frame’s work, but the return made on using a lower refresh rate is not a 1-to-1 conversion, nor is it guaranteed to be consistent across all use cases.
The maximum number of 60 frames per second videos cannot be taken, necessarily, to be half that of 30 frames per second videos. Other, more subtle, overheads exist outside of the data rate of the video that would have to be accounted for, and may well be influenced further by hardware configuration.
The correct number of layers for each case is discovered by using the built-in machine monitors over d3net. These display metrics to do with all aspects of hardware performance and are automatically collected and streamed while d3net sessions are hosted. The specific monitors used to qualify these layer counts are: FPS, GPU Profiler, Prefetcher Misses, and sometimes Prefetcher Requests. Between these monitors and a visible output, it is possible to verify the performance of each step in the rendering process, spot bottlenecks, and check those against the real video output.
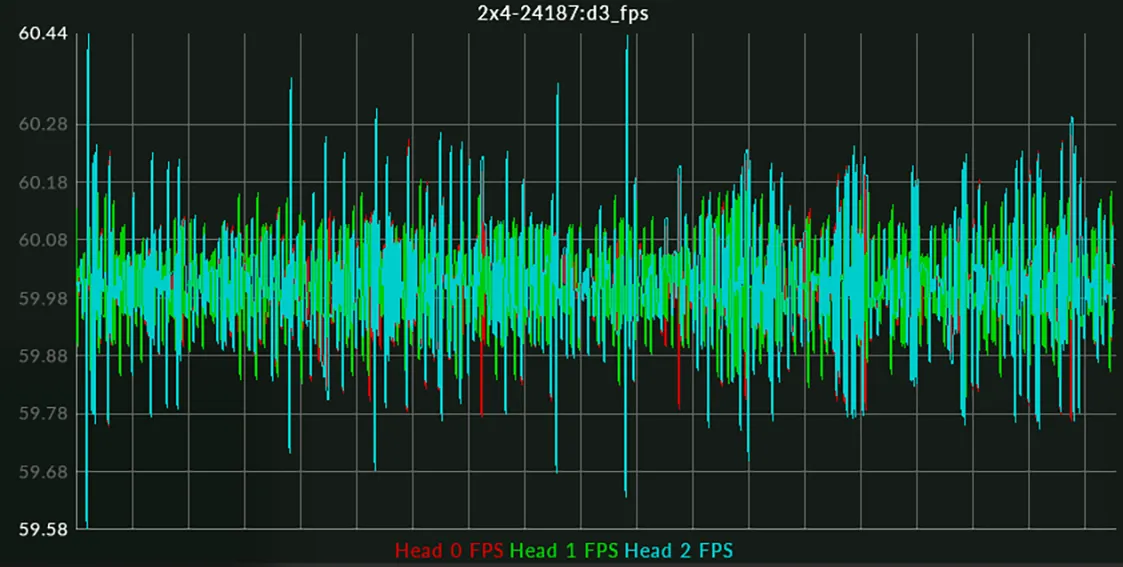
Good FPS: Y-axis shows all three heads are at values within a frame of 60fps. Some variation within this range is expected and attributed to minute differences in timing between the renderer and the metric gathering system.

Bad FPS: Consistent spikes down to 30fps on head 1 and 2 (green and cyan lines). Head 0 is the GUI and can be safely ignored if nothing else is dropping frames.

Good GPU Profiler: The GPU profiler shows how long the GPU is taking to perform a specific frame’s tasks. Provided that the magenta line stays below the duration of the frame in milliseconds, the GPU can be assumed to be handing each frame on time. In this case it is taking between 7.05ms and 8.05ms out of a total 16.67ms to perform that frame’s tasks.
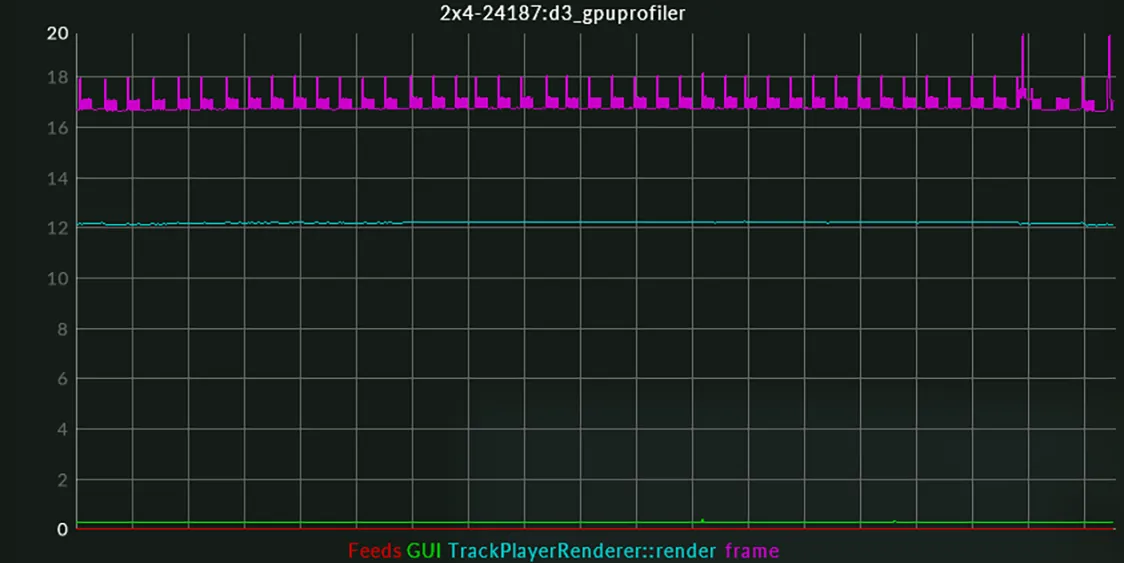
Bad GPU profiler: The magenta line is at or above 16.67ms. This implies that the GPU is taking longer than a frame’s duration to complete working on that frame and must drop a frame every so often to account for the lost time.

Good prefetcher requests: The prefetcher is the system that reads video data from the media drive in order to get it decoded and delivered to the renderer in time. Ideally, reading (green), decoding (cyan), decoded (purple) and delivered (yellow) should be flat lines of constant quantities steadily increasing with each new video. Waiting (red) and abandoned (orange) should be at 0 but small amount of waiting frames is acceptable.
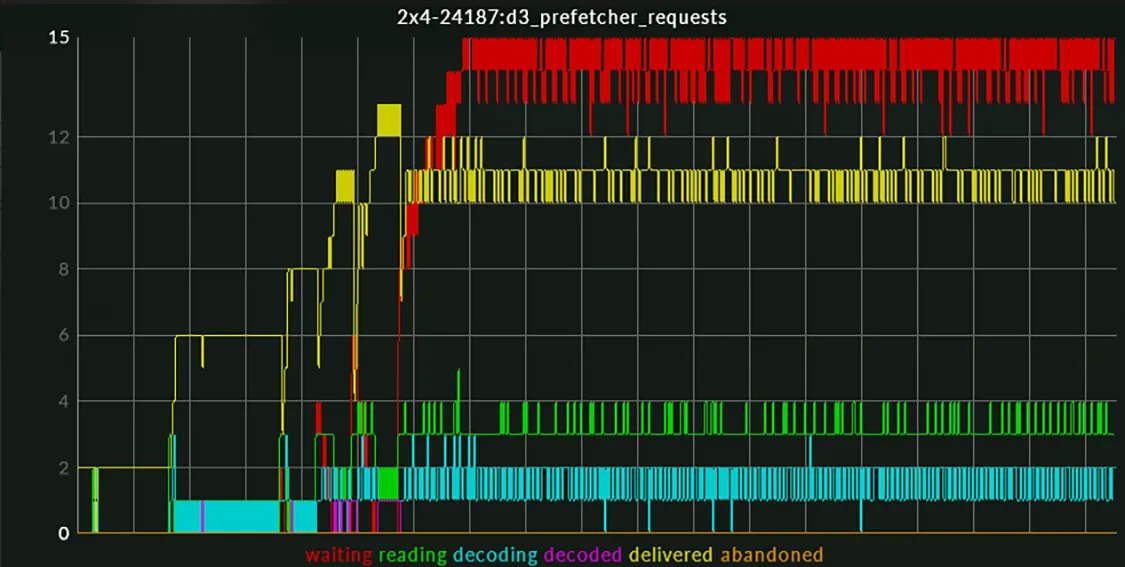
Bad prefetcher requests: Waiting (red) frames count has exceeded all other counters, implying a growing queue of things to be read from the media drive. The other counters have grown slightly erratic as a result and playback will be choppy. In these cases, the FPS is often still at 60 on the renderer, pointing to a bottleneck on the media drive.

Good prefetcher misses: A flat line at 0. The graph is a more simplified breakdown of prefetcher requests and will only report in situations like those shown in the bad prefetcher requests example.
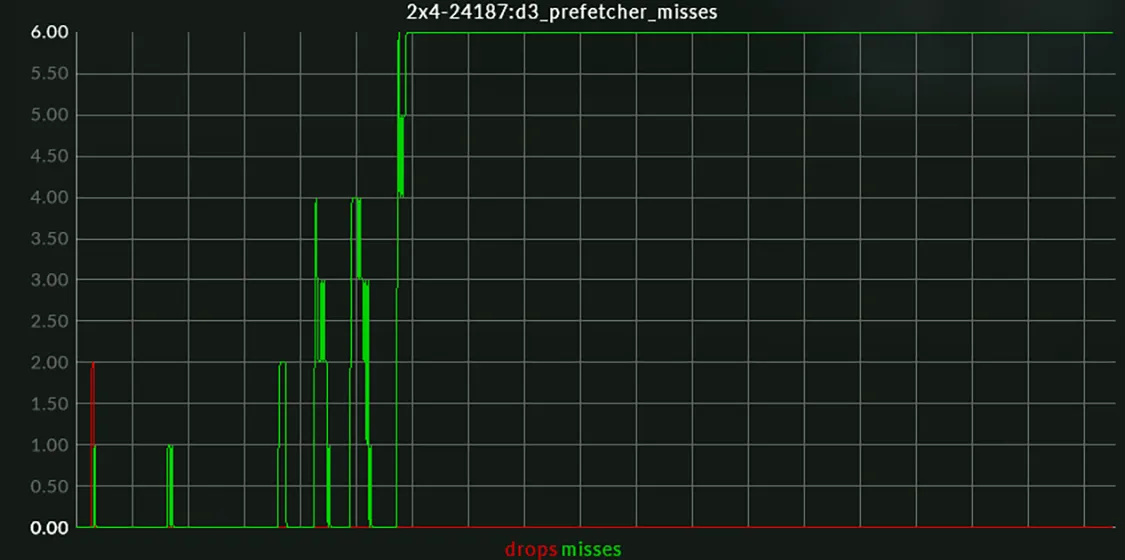
Bad prefetcher misses: A flat line at a value greater than 0. This means 6 video frames are missing their deadline per frame, the result is choppy output and again is likely to occur without affecting renderer framerate.
Armed with these remote monitors running on the Director machine, layers are then piled onto the Actor machine until one of them regularly falters during sustained playback. Each layer, with its unique copy of the same clip, is put into Locked mode and keyframed so that each layer delivers the same video frame at the same time. This ensures that any frames in the clip that are ‘difficult’ to decode all have an impact on the system at the same time. To put it another way: if the video layers were in normal mode, the exact moment-to-moment performance of the machine could vary depending on the time difference between each extra video being added to the stack. It is for this reason that the whole clip must be played through and the monitors observed for the duration.
The most layers the Actor can manage without any suspect behaviour from the monitors for the duration of the clip is recorded as the benchmark for that machine and software version. Machines that cannot operate as Actors are instead configured as mixed Directors, controlled and monitored by a remote editor in Lock to Master mode. While being tested they also have the timeline in a minimised state and no other GUI elements open. This ensures that the GPU can spend as much time as possible on the video playback task, and as little as possible on rendering the GUI.