Machine Monitoring Graphs
There are several machine monitoring graphs within Designer.
To open the Monitoring Manager, left-click on the FPS in the lower right corner of the track
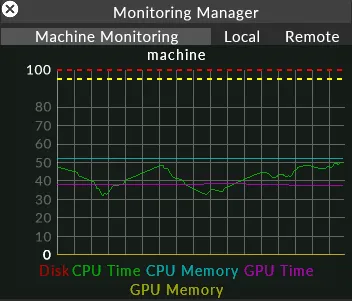
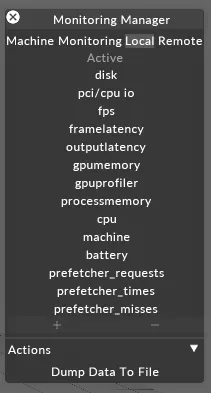
Once the Monitoring Manager window is open, left-click on Local to see the list of monitoring graphs:
Output Latency Graph
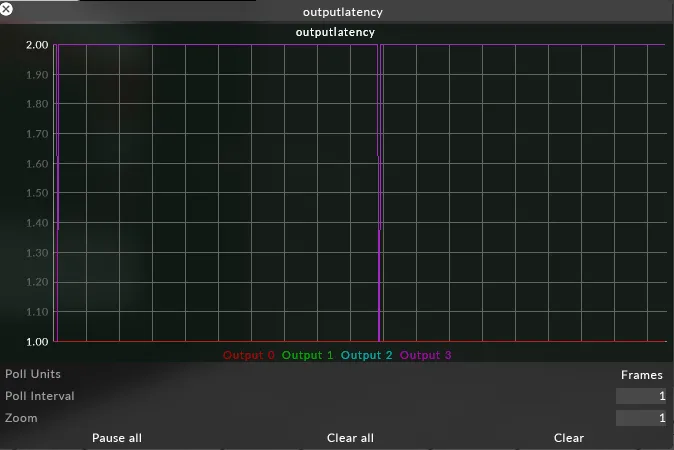
Section titled “Output Latency Graph”What is it?
Section titled “What is it?”This graph shows the queue length for each output. The queue length is dictated by whether the project is running at normal latency, low latency or ultra low latency.
This graph can be used to see dropped frames. If the queue length drops down by one, then a frame has been shipped before the next frame has joined the queue. Because frames are queued, this will not be seen on the output as a dropped frame. Running in ultra low latency where frames are shipped as soon as they have rendered, means that if the next frame is ready when a frame ships, you will see a frame drop.
If running at normal latency, but the graph line drops to zero, then frames are not ready fast enough which could manifest as framedrop.
GPU Profiler
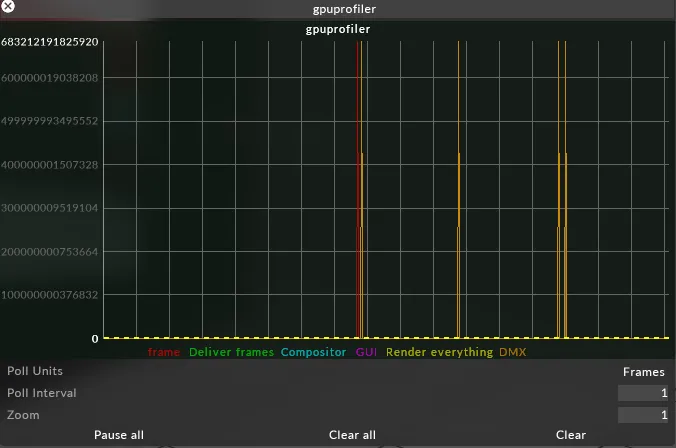
Section titled “GPU Profiler”What is it?
Section titled “What is it?”This is a cumulative graph that shows the amount of time spent in different tasks, e.g how much time spent in the GUI, how much time downloading DMX.
The sequence of events when playing back a video is:
Frames are loaded from video files -> decoded into RAM -> uploaded to the GPU -> rendered on the GPU.
The amount of time taken to render the frame on the GPU. This includes other rendering work, not just that related to video playback. When Frame finishes, the frame is ready to be presented.
Deliver Frames
Section titled “Deliver Frames”The amount of time a frame takes to upload to the GPU in the sequence of events described above.
Compositor
Section titled “Compositor”The composite time spent on all the track elements together.
The amount of time spent rendering the GUI.
Render Everything
Section titled “Render Everything”The cumulation of all the components that make up Compositor and GUI time.
The time spent downloading DMX
How do I use it?
Section titled “How do I use it?”When looking at the graph you can see how much time is spent in each part of the process. If any lines are going above the dotted lines then the server is dropping frames. The dotted lines indicate the maximum amount of time that can be spent at either 50fps or 60fps.
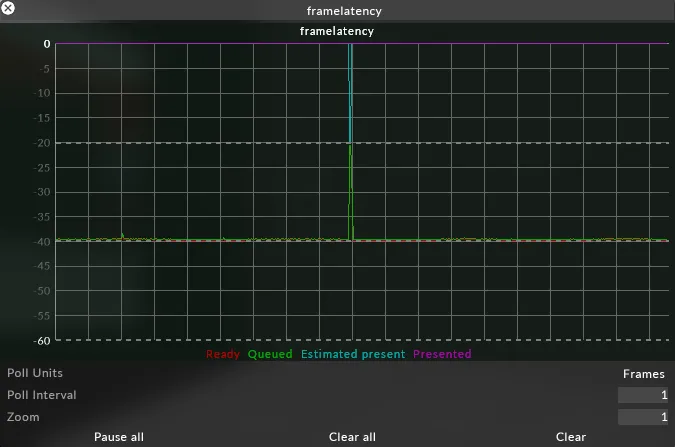
Frame Latency
Section titled “Frame Latency”What is it?
Section titled “What is it?”Graphs in milliseconds (ms) the journey of a frame from the time it is rendered through to being presented for output, relative to the present time which is 0.
The time that the frame was ready (rendered) at. Whenever a frame is rendered, it is ‘ready’. ‘Ready’ shows how many milliseconds in advance the frame was ready before it was actually presented. This value will vary based on the load on Disguise.
Queued
Section titled “Queued”Time the frame was added to the present queue. The present queue is Disguise notifying windows that this is an upcoming frame. This will most likely be identical to ‘ready’ as the frame is added to the queue as soon as it is rendered. The time may be higher if the queue is full, so the frame can’t be immediately added to the queue.
Estimated Present
Section titled “Estimated Present”From when it was added to the queue, the time at which it is estimated that the frame will be presented given the length of the queue.
Present
Section titled “Present”The time at which the frame was actually presented, which is always 0.
All other graphed values are relative to this.
How do I use it?
Section titled “How do I use it?”If Disguise is running slow, frames will not be ready in time and will be too close to 0, or after 0. This means it is dropping frames. You will also see that if running in low or ultra low latency mode, there is less time from ‘ready’ to ‘present’, and in half speed mode the frame is ready twice as early as in full speed mode.
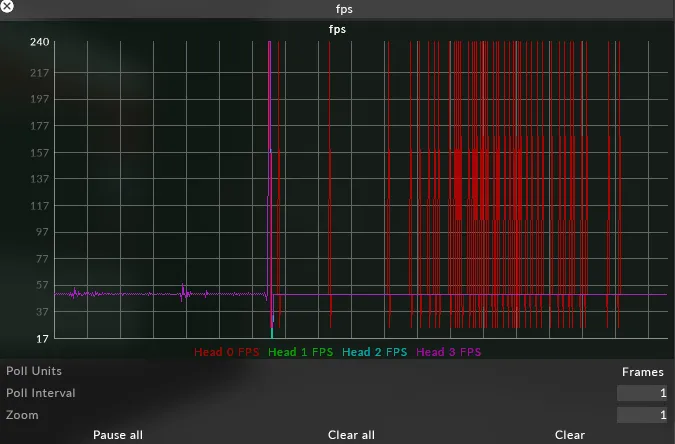
What is it?
Section titled “What is it?”Graphs the frames per second (FPS) per head
How do I use it?
Section titled “How do I use it?”Use this graph to see if you are dropping frames on any output head.
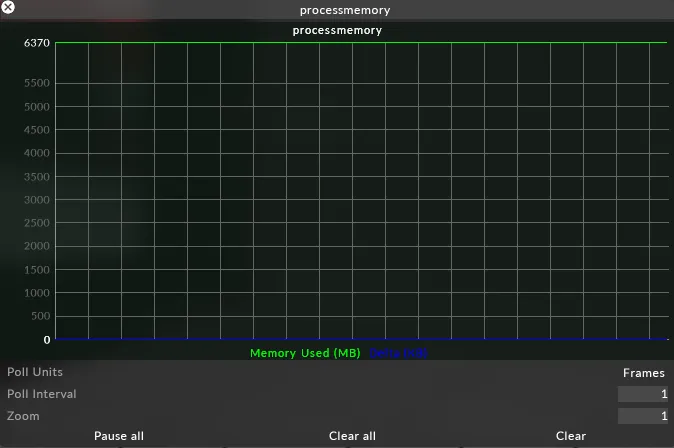
Process Memory
Section titled “Process Memory”What is it?
Section titled “What is it?”Memory Used (MB)
Section titled “Memory Used (MB)”How much memory Disguise is using.
Delta (KB)
Section titled “Delta (KB)”The difference between how much memory in use from one frame to the next.
How do I use it?
Section titled “How do I use it?”You can see values changing as you add and remove resources, e.g. many of the normal actions of setting up and programming a showfile.
This graph usually should not have to be used, but it can be used if experiencing crashes to make sure they are not memory related. If there is a memory leak, the delta will continuously spike in an upwards trend.
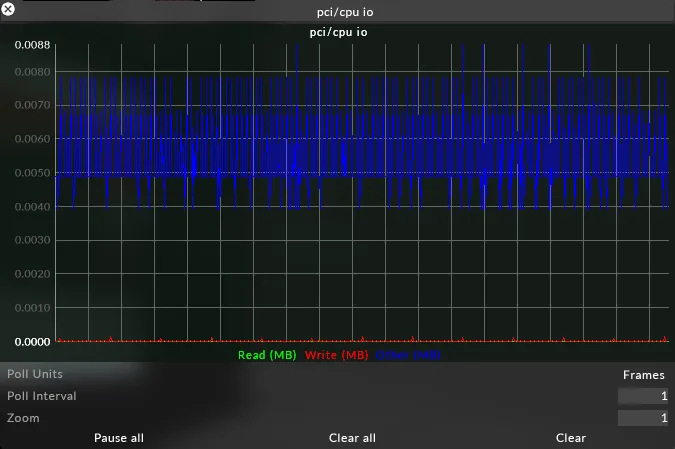
PCI/CPU IO
Section titled “PCI/CPU IO”What is it?
Section titled “What is it?”Graphs the data the CPU is reading from PCI devices.
Graphs the data the CPU is writing to PCI devices.
The number of bytes transferred during operations other than read and write.
How do I use it?
Section titled “How do I use it?”It is very unlikely that this graph will be needed in normal operation. Could be used if a fault with a PCI device or the motherboard is suspected.
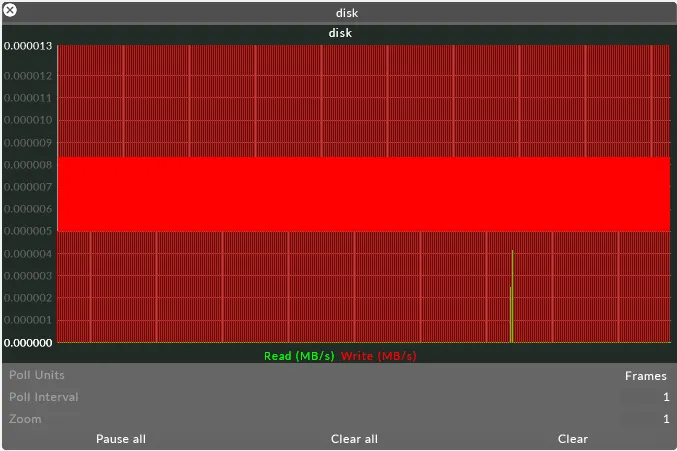
What is it?
Section titled “What is it?”Shows the read and write disk speed in MB/s.
How do I use it?
Section titled “How do I use it?”Could be used to see if you were bottlenecked somewhere e.g. read speed would go up and then plateau.
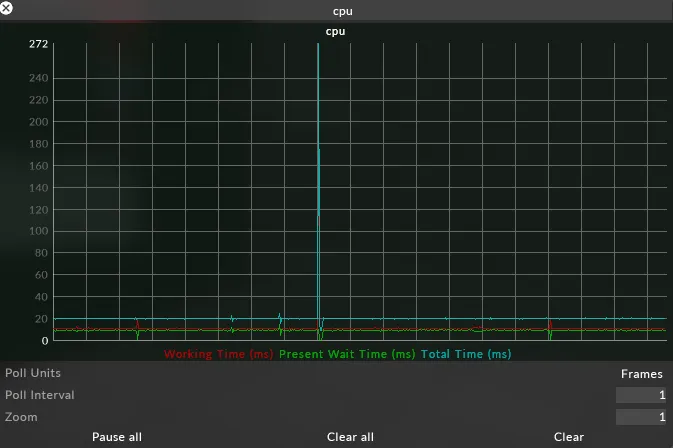
What is it?
Section titled “What is it?”The CPU graph is cumulative.
Working Time (ms)
Section titled “Working Time (ms)”The amount of time spent on the CPU
Present Wait Time (ms)
Section titled “Present Wait Time (ms)”The amount of time waiting to present. When running a project in normal latency this should be flat, but when running in ultra low latency this series will be ‘spikey’ as there’s no queue.
Total Time (ms)
Section titled “Total Time (ms)”Total time is the cumulation of working time and present wait time, and should always sit beneath the ms required at your FPS.
How do I use it?
Section titled “How do I use it?”In a normal setup, total time should be flat because Disguise takes the full CPU cycle to present a frame. At the end of every update loop, something is given to the GPU to present. If that loop is finished early, then there has to be a wait before there is a slot available in the queue.
If the CPU working time is high and the present time is low, then this is because the queue is empty. If frames are dropped in this scenario, then it is because of CPU load.
GPU Memory
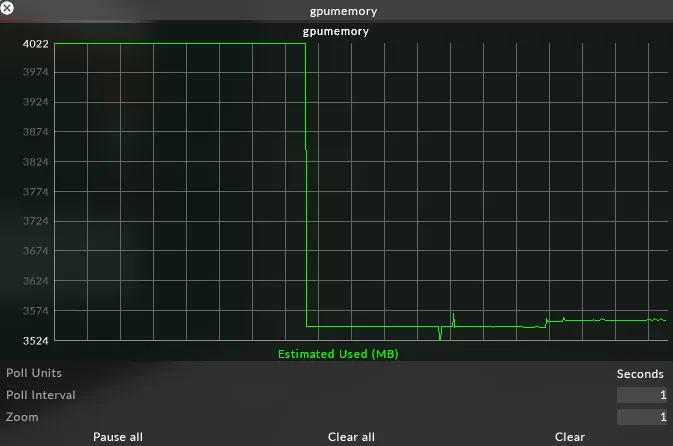
Section titled “GPU Memory”What is it?
Section titled “What is it?”This graph shows the amount of memory that the GPU is currently using.
The GPU is responsible for dealing with its own memory allocation, but Disguise tries to be as efficient as possible with the GPU memory it requires.
All textures that are rendering onscreen in the GUI are bitmaps that are uploaded to the GPU. This includes all GUI elements, as well as any media that is playing back.
Disguise tries to reduce the amount of GPU memory in use by evicting textures when they are no longer needed. If textures are not used for a while, they are evicted. Conversely, some textures e.g LUTS are expensive to upload to the GPU, but once they are uploaded they are fast to use. For this reason, Disguise tells the GPU to keep these textures alive.
How do I use it?
Section titled “How do I use it?”Not commonly needed, but if a bug e.g. a memory leak, is suspected, a constantly increasing GPU Memory value is useful information for reporting the suspected bug. GPU Memory will increase as textures are uploaded, and decrease as they are evicted.
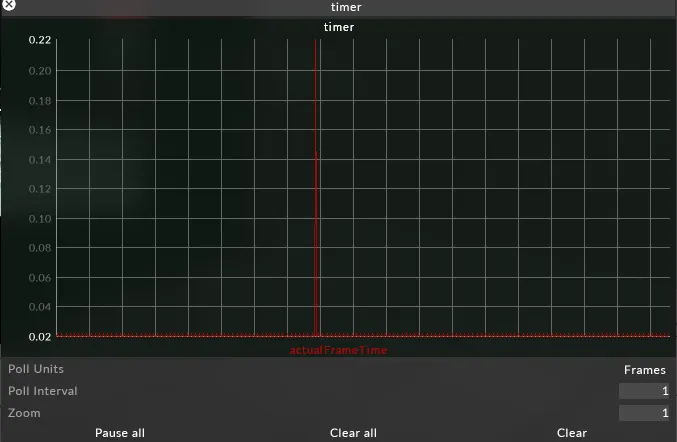
What is it?
Section titled “What is it?”actualFrameTime is the clock of the next upcoming present, and the delta is the amount of time passed between each frame time.
How do I use it?
Section titled “How do I use it?”This value should remain constant, at a value dictated by the fps of the system.
Monitoring RenderStream Graphs Reference
Section titled “Monitoring RenderStream Graphs Reference”Where can I find RenderStream graphs?
Section titled “Where can I find RenderStream graphs?”There are two places where we can find RenderStream graphs:
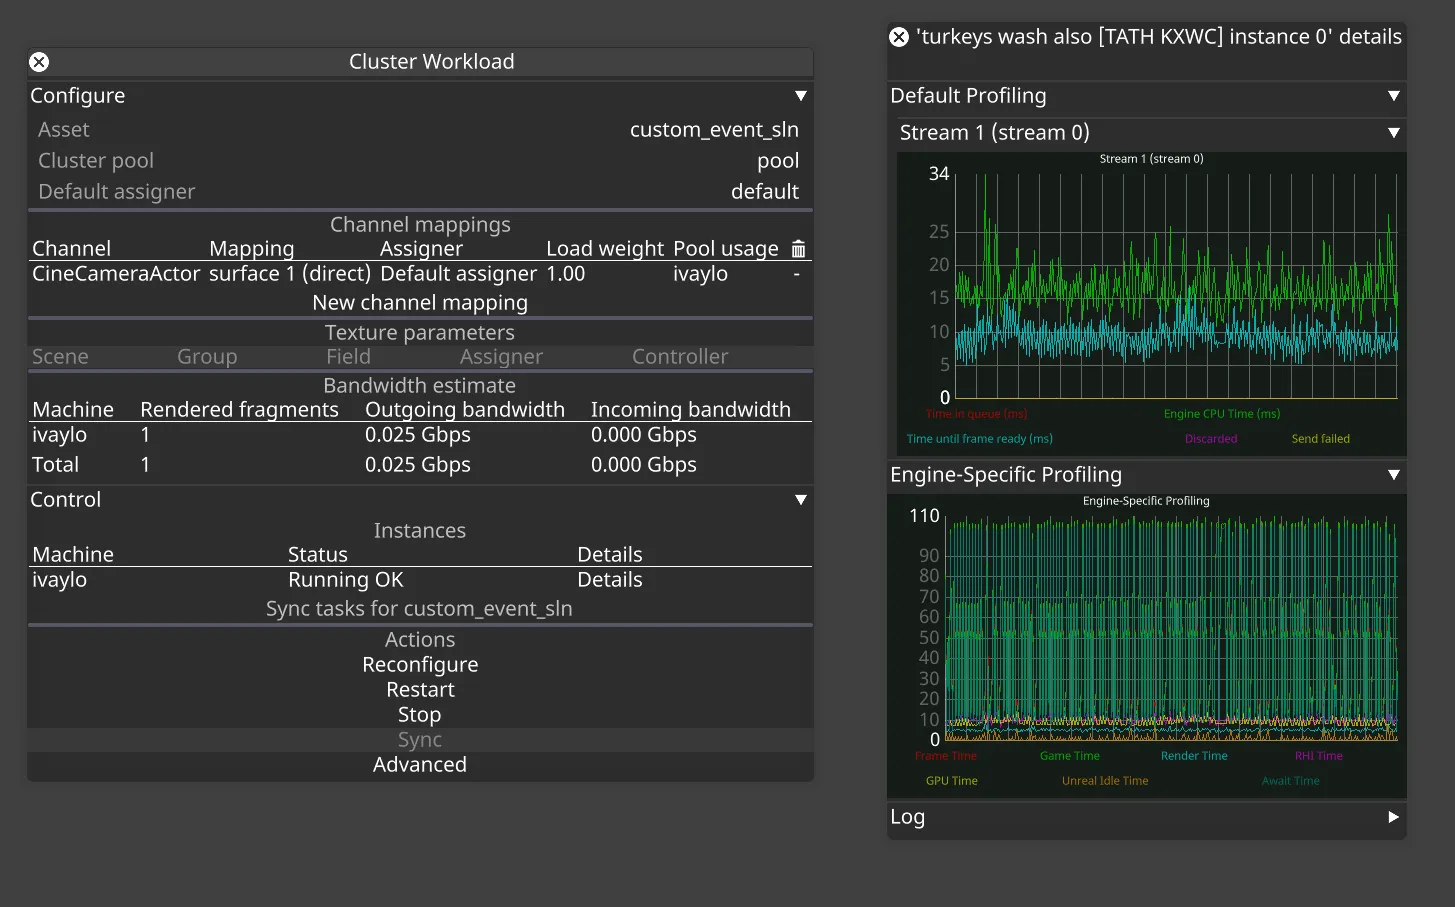
- The Details view of one of the machines in a workload
- shows engine and stream profiling for a specific render node machine
- can be accessed via the ‘Details’ button next to a specific machine in workload widget
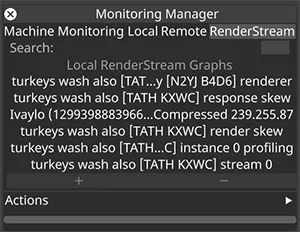
- The ‘RenderStream’ tab of the Monitoring Manager
- lists all graphs for all streams and workloads
- graphs are grouped by actors receiving the streams
- can be accessed via the Monitoring Manager (left-click on FPS bug in Disguise)
RenderStream graphs
Section titled “RenderStream graphs”Renderer graph
Section titled “Renderer graph”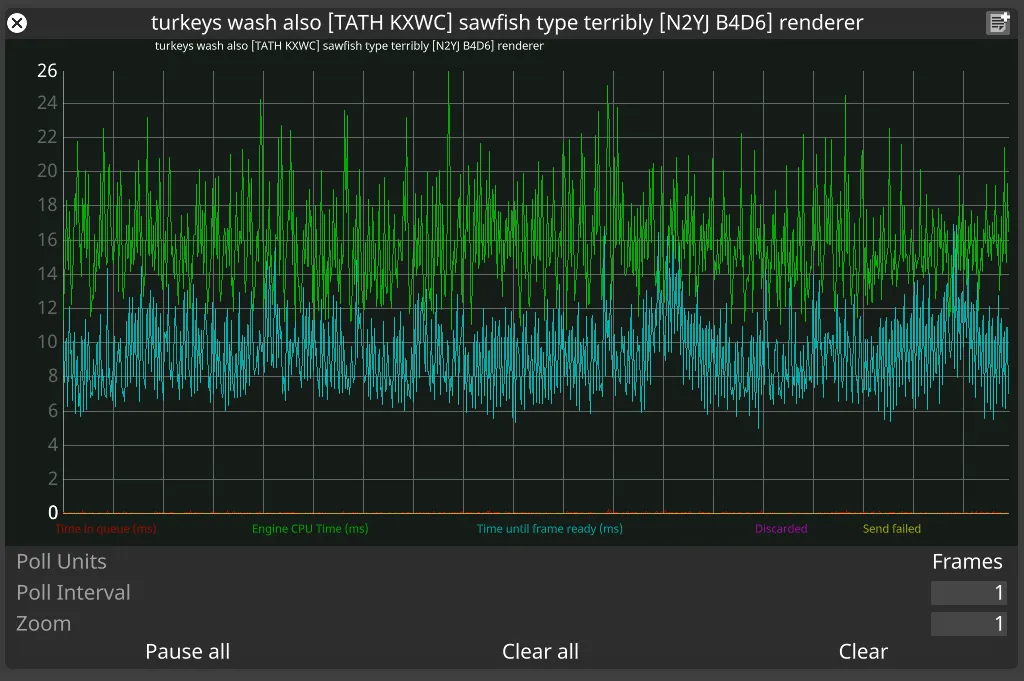
What is it?
Section titled “What is it?”Engine-agnostic profiling data captured by the RenderStream plugin from the render node.
Time in queue (ms)
Section titled “Time in queue (ms)”The time a frame request spends waiting to be picked up for processing by the workload instance.
Engine CPU time (ms)
Section titled “Engine CPU time (ms)”How much time the frame request spends being processed. It is the time between the frame request being picked up for processing and the call to send the resulting frame back to disguise.
Time until frame ready (ms)
Section titled “Time until frame ready (ms)”How long it takes to send the frame.
Discarded
Section titled “Discarded”Shows the frames dropped by the render node.
Send failed
Section titled “Send failed”Shows problems in sending the frames back to disguise.
How do I use it?
Section titled “How do I use it?”Normally, time in queue should be minimal with most of the time spent generating the frame indicated by Engine CPU time (ms). No requests should be discarded or marked as send failed.
High Time in queue: engine can’t keep up with the rate of incoming requests from disguise. Eventually, if too many requests are waiting in the queue, the render node will discard request, which will be reflected in the Discarded line in the graph.
High Time until frame ready: indication of sending/networking issues
Profiling graph
Section titled “Profiling graph”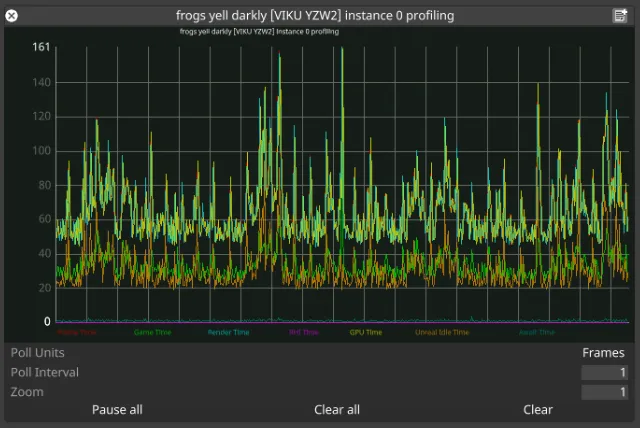
What is it?
Section titled “What is it?”Engine-specific profiling information for a workload instance. This data is specific to each RenderStream plugin implementation, or could be missing depending on the implementation as well.
How do I use it?
Section titled “How do I use it?”The data we get completely depends on what engine data a particular plugin implementation is tapping into. In the case imaged above, we have Unreal Engine with granular data about how much time each step of the UE pipeline is taking. Abnormally high values in any of these sections could indicate high CPU usage (blueprints, geometry, physics, etc.), high GPU usage (resolution, post-processing, etc.), or other issues. For example, high Unreal Idle Time could indicate network slowdowns in nDislpay synchronisation.
Stream graph
Section titled “Stream graph”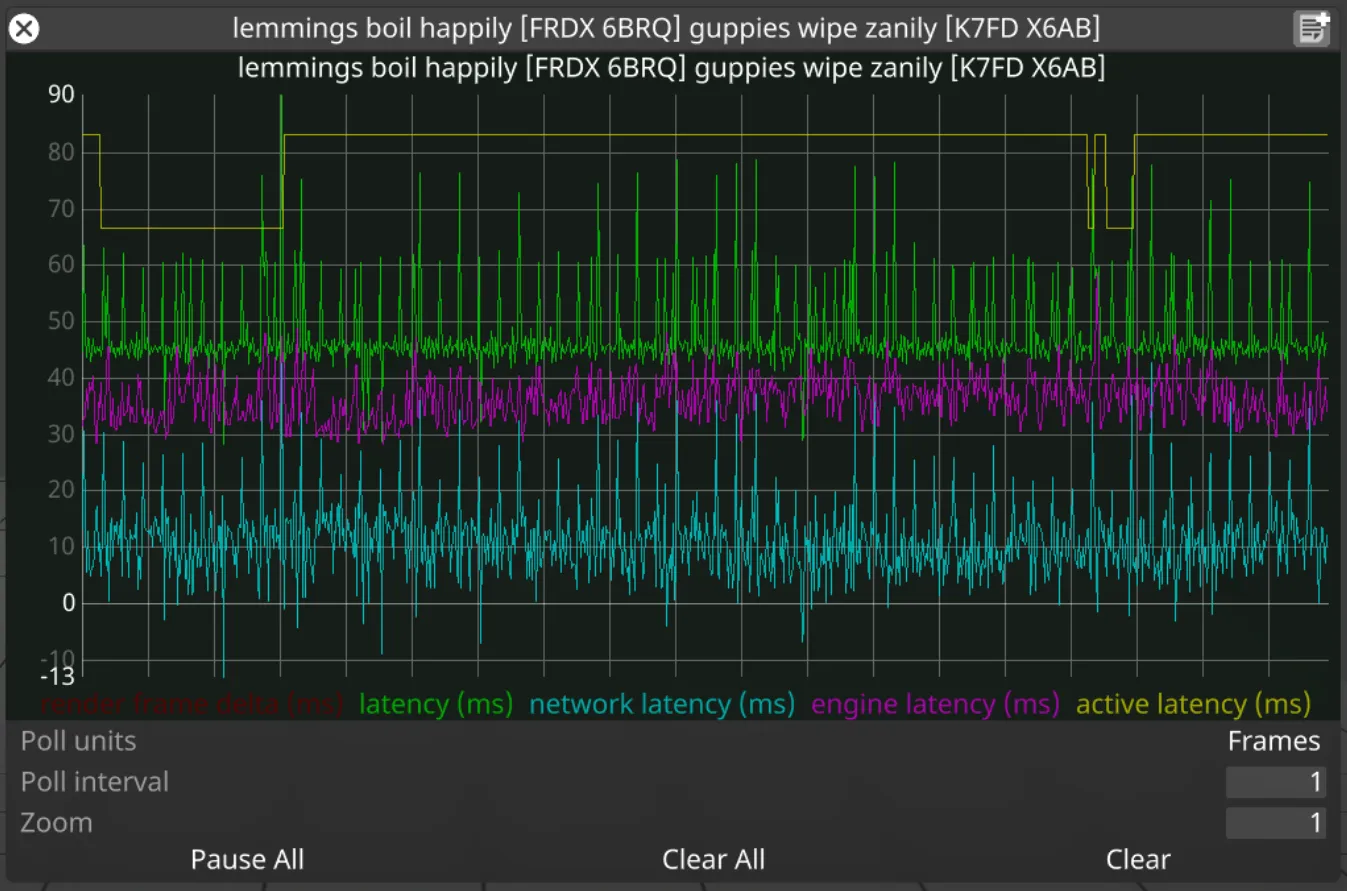
What is it?
Section titled “What is it?”Data generated by the receiver of a stream (actor/director) describing the latency of the stream.
render frame delta (ms)
Section titled “render frame delta (ms)”Shows the difference in timestamps between arriving frame and the frame that arrived before it.
latency (ms)
Section titled “latency (ms)”Actual latency of a stream: the time elapsed between Disguise requesting a frame and then receiving back the frame for that request. This is equal to the sum of network latency and engine latency.
network latency (ms)
Section titled “network latency (ms)”The time attributed to network communication and compression for compressed streams.
engine latency (ms)
Section titled “engine latency (ms)”The time attributed to render engine CPU and GPU operations.
active latency (ms)
Section titled “active latency (ms)”The current active latency which is based on the slowest stream in the session.
How do I use it?
Section titled “How do I use it?”Render frame delta should be constant (at 60fps, delta should be 16.6ms). Fluctuations identify either dropped frame requests or unstable framerate on the RenderStream controller machine.
Latency should not be too far off from the active latency. If there is a stream that is significantly faster than other streams, its latency will show as a lot lower than the active latency. If the difference between the two is greater than 4 frames worth of time, effort should be made to better balance the workload. Also, if using a manual active latency override, this could be an indication that the override value is not accurate.
Active latency and latency should not fluctuate wildly. That could indicate optimisation is required on the asset side.
Render skew graph
Section titled “Render skew graph”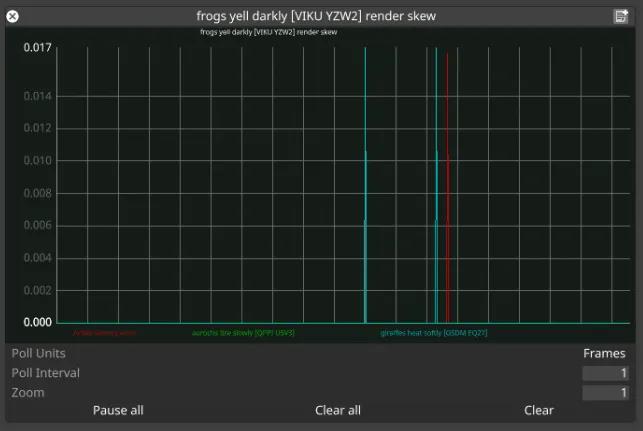
What is it?
Section titled “What is it?”The graph shows how well temporally matched are the frames received across the streams of a workload.
Active latency error
Section titled “Active latency error”Shows how close to the active latency prediction are the displayed frames of a RenderStream workload. This is the difference between the expected timestamp based on active latency and the actual timestamp of the closest matching group of frames.
Streams error
Section titled “Streams error”Within the best matching group of frames, these lines indicate the individual stream errors.
How do I use it?
Section titled “How do I use it?”Ideally, active latency error should be zero with the individual stream errors being less than a frame worth of time.
- If individual streams have error greater than a frame worth of time, this could be perceived as a tear between fragments that belong to the same actor.
- If the active latency error differs across multiple subscribing actors (across multiple instances of this graph), this could be perceived as a tear on the edge between the outputs of two actors.
Response skew graph
Section titled “Response skew graph”
What is it?
Section titled “What is it?”Shows how close to the active latency prediction is the currently processed RenderStream response. This is the difference between the expected timestamp based on active latency and the actual timestamp of the closest matching group of frame responses (frame sent notifications from render nodes).
How do I use it?
Section titled “How do I use it?”This can be used as another indication how well the active latency estimation fits a stream. Ideally, the error in this graph should be less than a frame worth of time. More than a frame of error could indicate network issues on the d3net network adapter, as it is the one used for sending RenderStream frame requests and receiving the sent notifications replies from render nodes.