DMX Table Screens
A DMX table screen is a DMXscreen whose DMX patch is defined by a csv file. The behavior of the screen is much like the DMXscreen except that the patch is automated by the csv file allowing for more fluid patch mechanisms for non-linear patching.
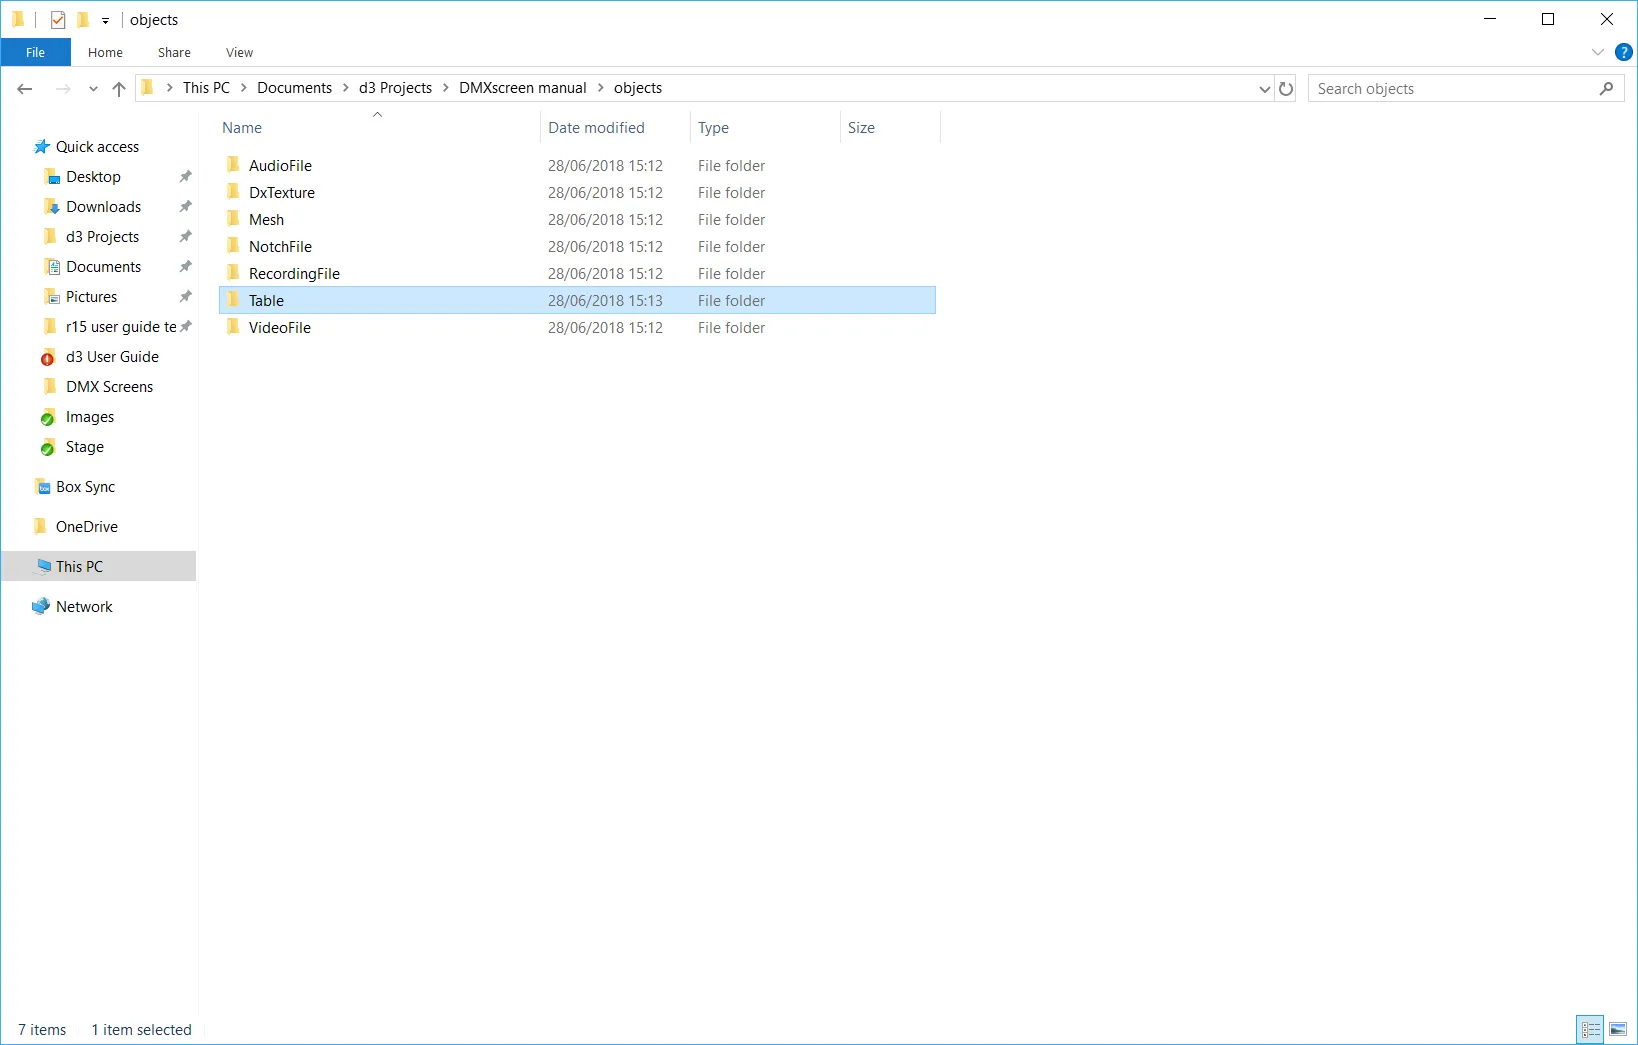
Tables should be placed in a newly created Table folder, inside theObjects folder of the project file.
CSV format
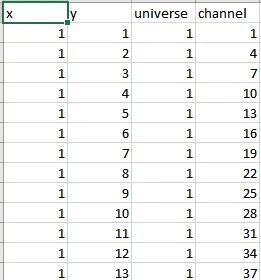
Section titled “CSV format”The first line is the four column headers (pos x, pos y, universe, channel) and is ignored. These properties are explained as follows.
x position
Section titled “x position”x coordinate of the pixel, zero-based, relative to the resolution of the mesh as defined in . 0 is left.
y position
Section titled “y position”y coordinate of the pixel, zero-based, relative to the resolution of the mesh as defined in . 0 is top.
universe
Section titled “universe”DMX universe number offset, 1-based, relative to the start universe of the screen as defined in Designer.
channel
Section titled “channel”DMX start channel number offset of the pixel, 1-based, relative to the start address of the screen as defined in Designer.
Workflow
Section titled “Workflow”- Create your DMX patch using a CSV or spreadsheet editor.
- Create your DMXscreen in as normal remembering to set the resolution correctly.
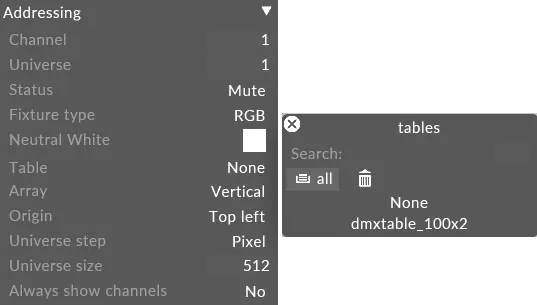
- Use the Table property of the screen to point to the CSV file that defines the channel assignments.
Example
Section titled “Example”Creating a table in excel
Section titled “Creating a table in excel”- Define the column order in Excel.
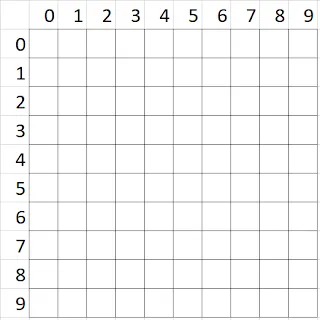
- So if the resolution of the Screen is 10x10 for example then the co-ordinates of the UV space would look like the image below.
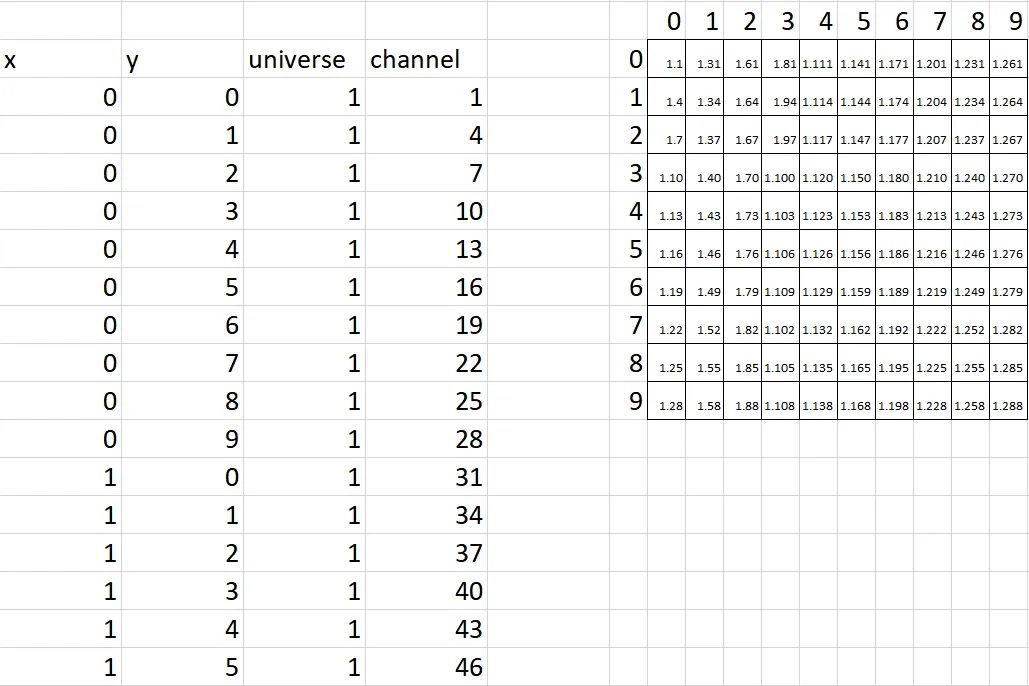
- If the Fixture is a 3 channel fixture, then the address would be as follows compared to the table screen.
- Now export the x, ,y, universe, channel information as a .csv file.
Excel table creation tip
Section titled “Excel table creation tip”The following method expects the LEDs to be addressed column by column, left-to-right. If you require a different addressing order, the x and y equations can be swapped.
x column
Section titled “x column”Use the equation =TRUNC((ROW()-1)/y), repeat this down the sheet to x*y number of rows, this will make each number from 0 to x repeat y-number
of times.
y column
Section titled “y column”Use the equation =TRUNC(ROW()-1)-(y*(TRUNC((ROW()-1)/y))), repeat this down the sheet to x*y number of rows. This will make the numbers from 0
to y repeat with each number from 0 to x, covering every permutation of these two ranges.
Universe column
Section titled “Universe column”Find the maximum number of LEDs you can fit in one universe (n). For RGB or any other three-channel LED’s this number is 170. Use the equation =TRUNC(((ROW()+(n-1)/n), repeat for x*y rows.
Channel column
Section titled “Channel column”Put a 1 in the first row, then =MOD(D1+i, 510) (where i is the number of channels required by a single LED) in the next row down, copy down letting the D co-ordinate increment. 510 is obtained by adding 1 to the highest addressable number (509 in the case of RGB LED’s), repeat for x*y rows.
Once this is complete, export as csv, open in a text editor, create a new line at the top of the list and type x,y,universe,channel. Save the csv and use it in Designer.
Placing the CSV file
Section titled “Placing the CSV file”- Copy the exported CSV file from excel.
- Create a new folder inside the objects folder of your project file name this folder Table.
- Paste the CSV file into this newly created table folder.
Creating the DMX TableScreen
Section titled “Creating the DMX TableScreen”- Open the stage editor by right-clicking Stage from the dashboard or by right-clicking the floor in the visualiser.
- Expand the DMXscreens tab.
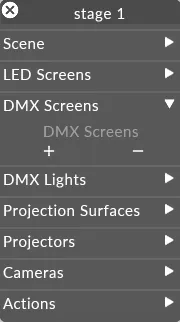
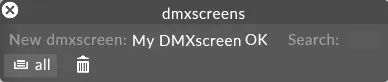
- Click the + icon to open the DMXscreens manager.
- Define a name for your screen and left-click OK.
- Position your screen in the stage as normal.
- Define the Table property as the CSV file you placed in the Table folder earlier.