Understanding RenderStream Graphs
Where can I find RenderStream graphs?
Section titled “Where can I find RenderStream graphs?”There are two places where we can find RenderStream graphs:
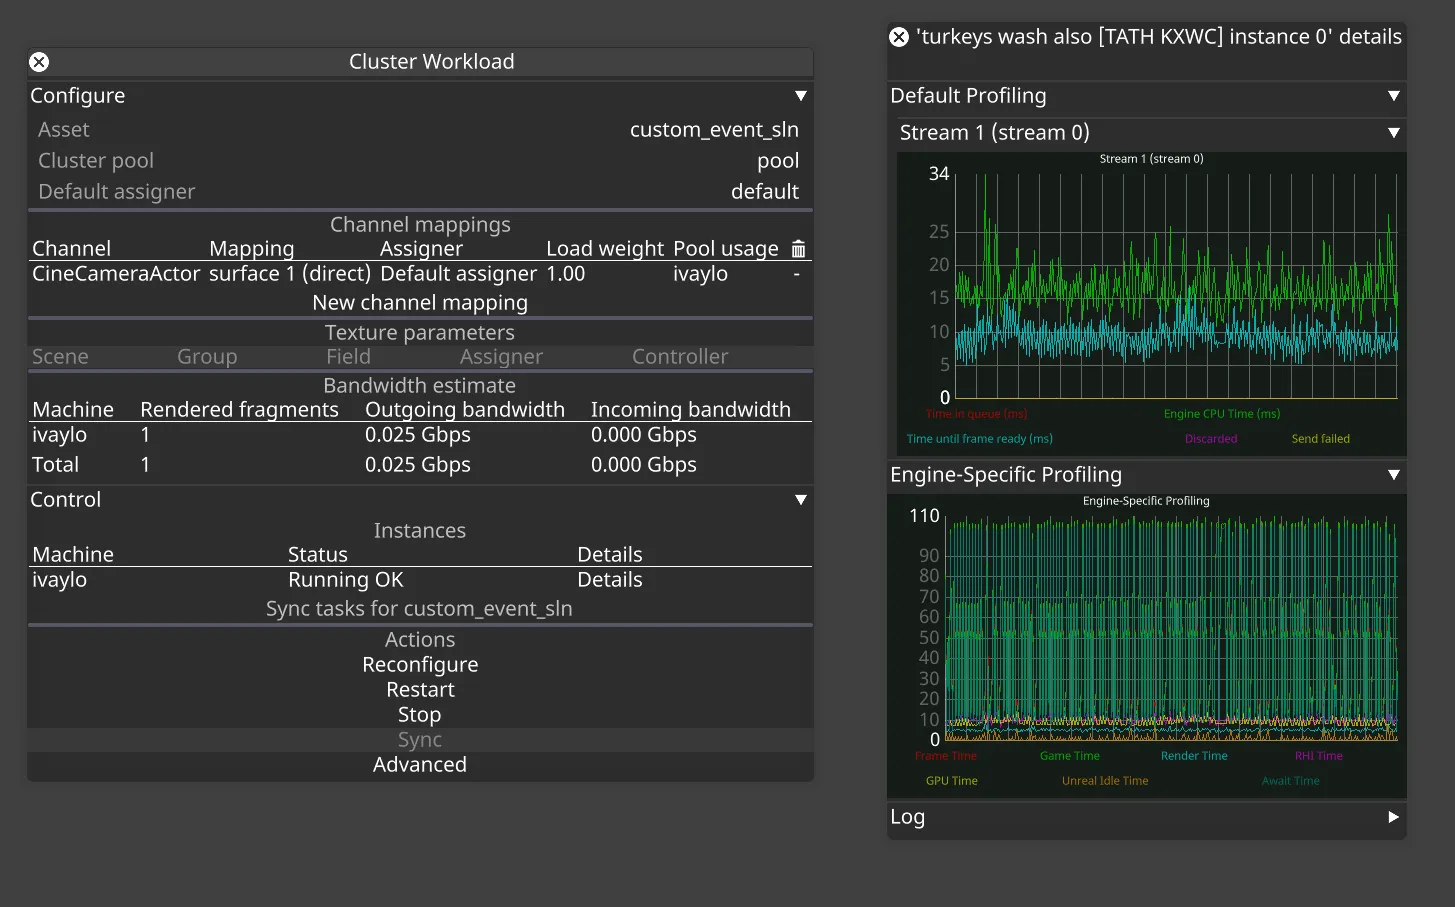
- The Details view of one of the machines in a workload
- shows engine and stream profiling for a specific render node machine
- can be accessed via the ‘Details’ button next to a specific machine in workload widget
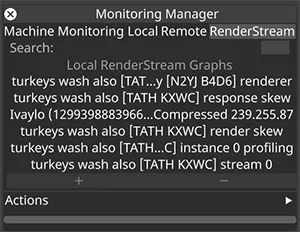
- The ‘RenderStream’ tab of the Monitoring Manager
- lists all graphs for all streams and workloads
- graphs are grouped by actors receiving the streams
- can be accessed via the Monitoring Manager (left-click on FPS bug in Disguise)
RenderStream graphs
Section titled “RenderStream graphs”Renderer graph
Section titled “Renderer graph”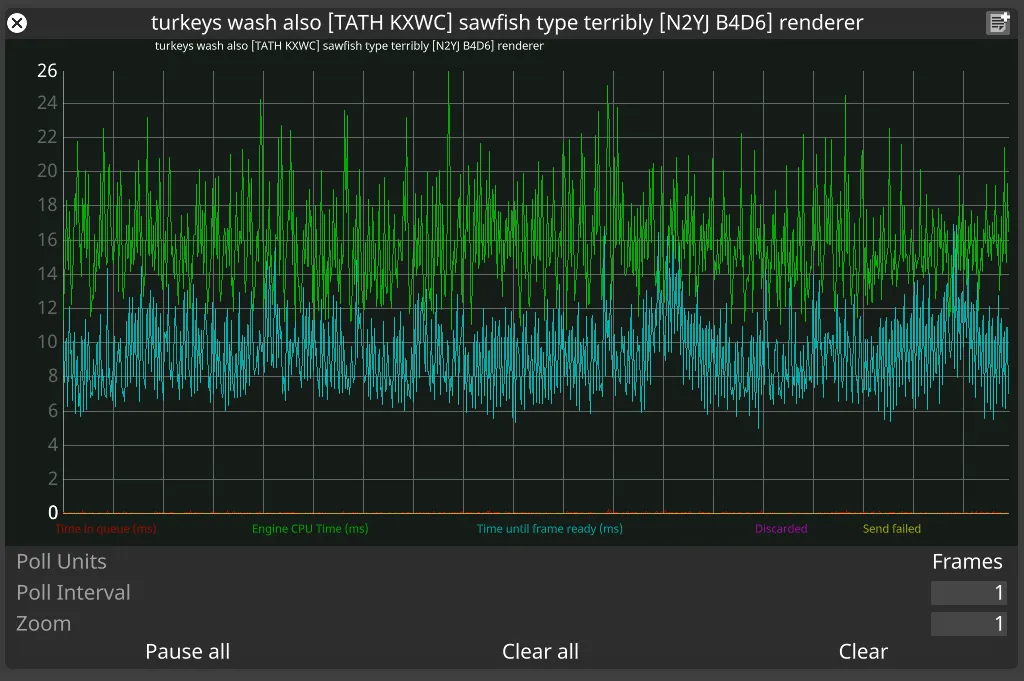
What is it?
Section titled “What is it?”Engine-agnostic profiling data captured by the RenderStream plugin from the render node.
Time in queue (ms)
Section titled “Time in queue (ms)”The time a frame request spends waiting to be picked up for processing by the workload instance.
Engine CPU time (ms)
Section titled “Engine CPU time (ms)”How much time the frame request spends being processed. It is the time between the frame request being picked up for processing and the call to send the resulting frame back to disguise.
Time until frame ready (ms)
Section titled “Time until frame ready (ms)”How long it takes to send the frame.
Discarded
Section titled “Discarded”Shows the frames dropped by the render node.
Send failed
Section titled “Send failed”Shows problems in sending the frames back to disguise.
How do I use it?
Section titled “How do I use it?”Normally, time in queue should be minimal with most of the time spent generating the frame indicated by Engine CPU time (ms). No requests should be discarded or marked as send failed.
High Time in queue: engine can’t keep up with the rate of incoming requests from disguise. Eventually, if too many requests are waiting in the queue, the render node will discard request, which will be reflected in the Discarded line in the graph.
High Time until frame ready: indication of sending/networking issues
Profiling graph
Section titled “Profiling graph”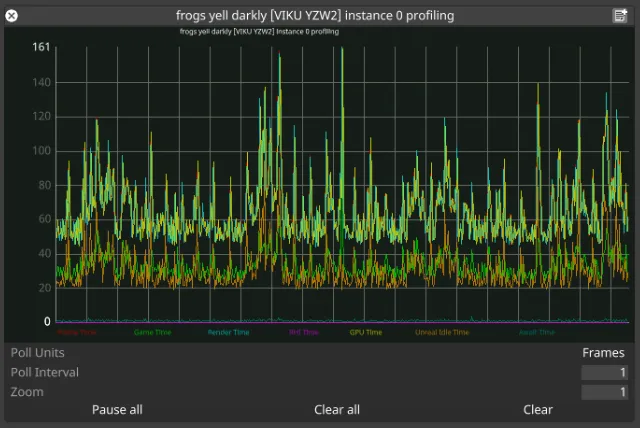
What is it?
Section titled “What is it?”Engine-specific profiling information for a workload instance. This data is specific to each RenderStream plugin implementation, or could be missing depending on the implementation as well.
How do I use it?
Section titled “How do I use it?”The data we get completely depends on what engine data a particular plugin implementation is tapping into. In the case illustrated above, we have Unreal Engine with granular data about how much time each step of the UE pipeline is taking. Abnormally high values in any of these sections could indicate high CPU usage (blueprints, geometry, physics, etc.), high GPU usage (resolution, post-processing, etc.), or other issues. For example, high Unreal Idle Time could indicate network slowdowns in nDisplay synchronisation.
Stream graph
Section titled “Stream graph”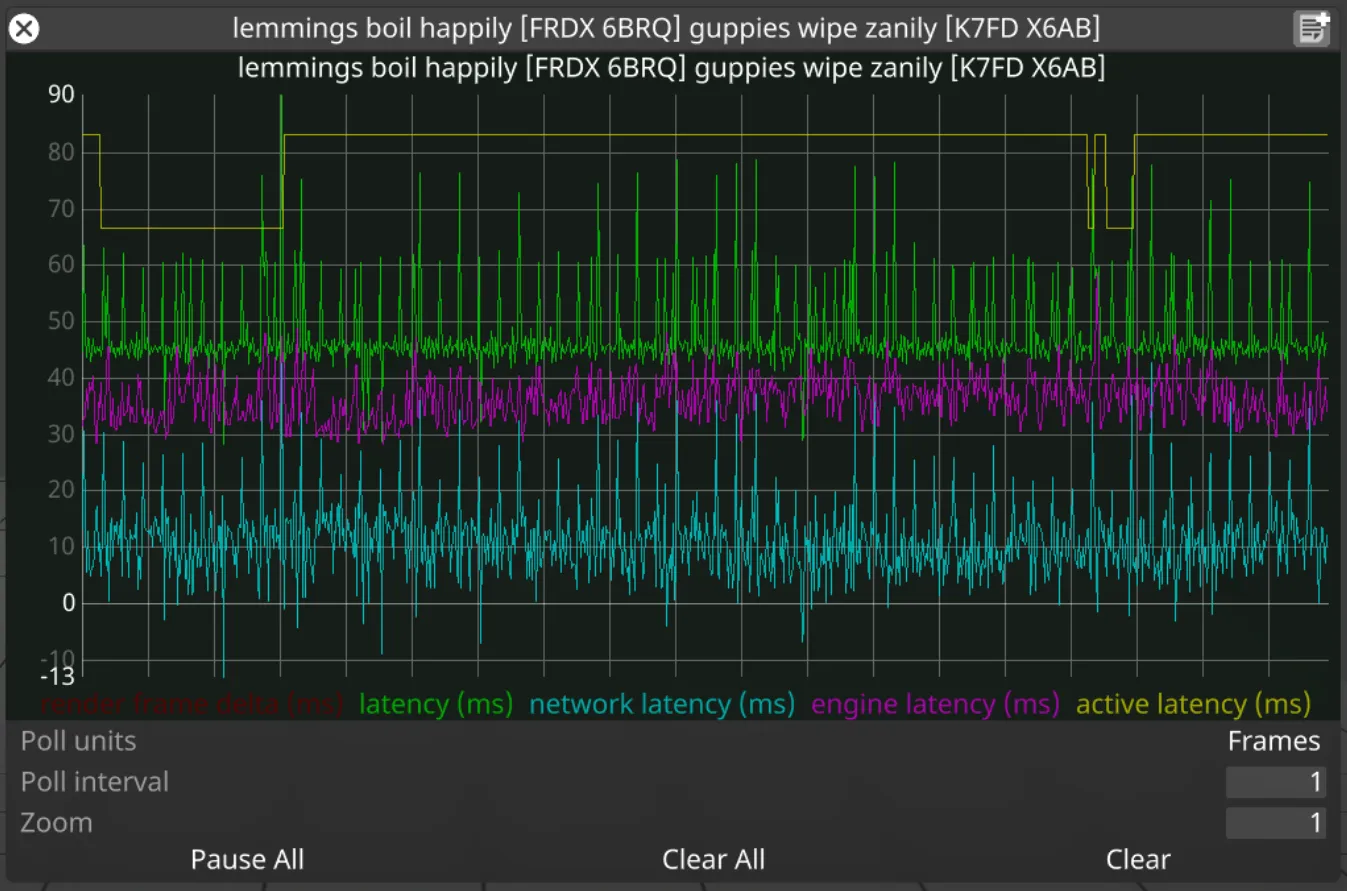
What is it?
Section titled “What is it?”Data generated by the receiver of a stream (actor/director) describing the latency of the stream.
render frame delta (ms)
Section titled “render frame delta (ms)”Shows the difference in timestamps between arriving frame and the frame that arrived before it.
latency (ms)
Section titled “latency (ms)”Actual latency of a stream: the time elapsed between disguise requesting a frame and then receiving back the frame for that request.
active latency (ms)
Section titled “active latency (ms)”The current active latency which is based on the slowest stream in the session.
How do I use it?
Section titled “How do I use it?”Render frame delta should be constant (at 60fps, delta should be 16.6ms). Fluctuations identify either dropped frame requests or unstable framerate on the RenderStream controller machine.
Latency should not be too far off from the active latency. If there is a stream that is significantly faster than other streams, its latency will show as a lot lower than the active latency. If the difference between the two is greater than 4 frames worth of time, effort should be made to better balance the workload. Also, if using a manual active latency override, this could be an indication that the override value is not accurate.
Active latency and latency should not fluctuate wildly. That could indicate optimisation is required on the asset side.
Render skew graph
Section titled “Render skew graph”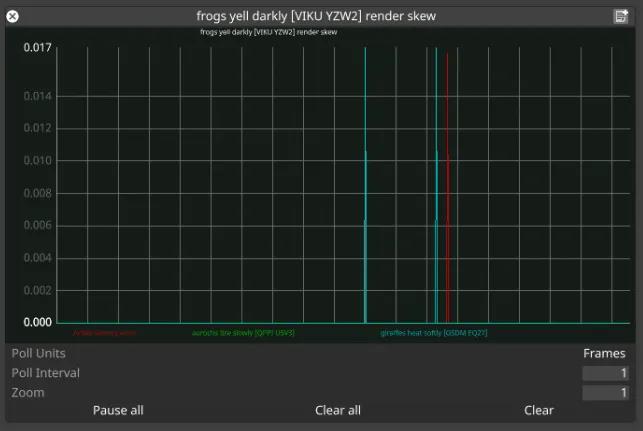
What is it?
Section titled “What is it?”The graph shows how well temporally matched are the frames received across the streams of a workload.
Active latency error
Section titled “Active latency error”Shows how close to the active latency prediction are the displayed frames of a RenderStream workload. This is the difference between the expected timestamp based on active latency and the actual timestamp of the closest matching group of frames.
Streams error
Section titled “Streams error”Within the best matching group of frames, these lines indicate the individual stream errors.
How do I use it?
Section titled “How do I use it?”Ideally, active latency error should be zero with the individual stream errors being less than a frame worth of time.
- If individual streams have error greater than a frame worth of time, this could be perceived as a tear between fragments that belong to the same actor.
- If the active latency error differs across multiple subscribing actors (across multiple instances of this graph), this could be perceived as a tear on the edge between the outputs of two actors.
Response skew graph
Section titled “Response skew graph”
What is it?
Section titled “What is it?”Shows how close to the active latency prediction is the currently processed RenderStream response. This is the difference between the expected timestamp based on active latency and the actual timestamp of the closest matching group of frame responses (frame sent notifications from render nodes).
How do I use it?
Section titled “How do I use it?”This can be used as another indication how well the active latency estimation fits a stream. Ideally, the error in this graph should be less than a frame worth of time. More than a frame of error could indicate network issues on the d3net network adapter, as it is the one used for sending RenderStream frame requests and receiving the sent notifications replies from render nodes.
Texture parameter latency graph
Section titled “Texture parameter latency graph”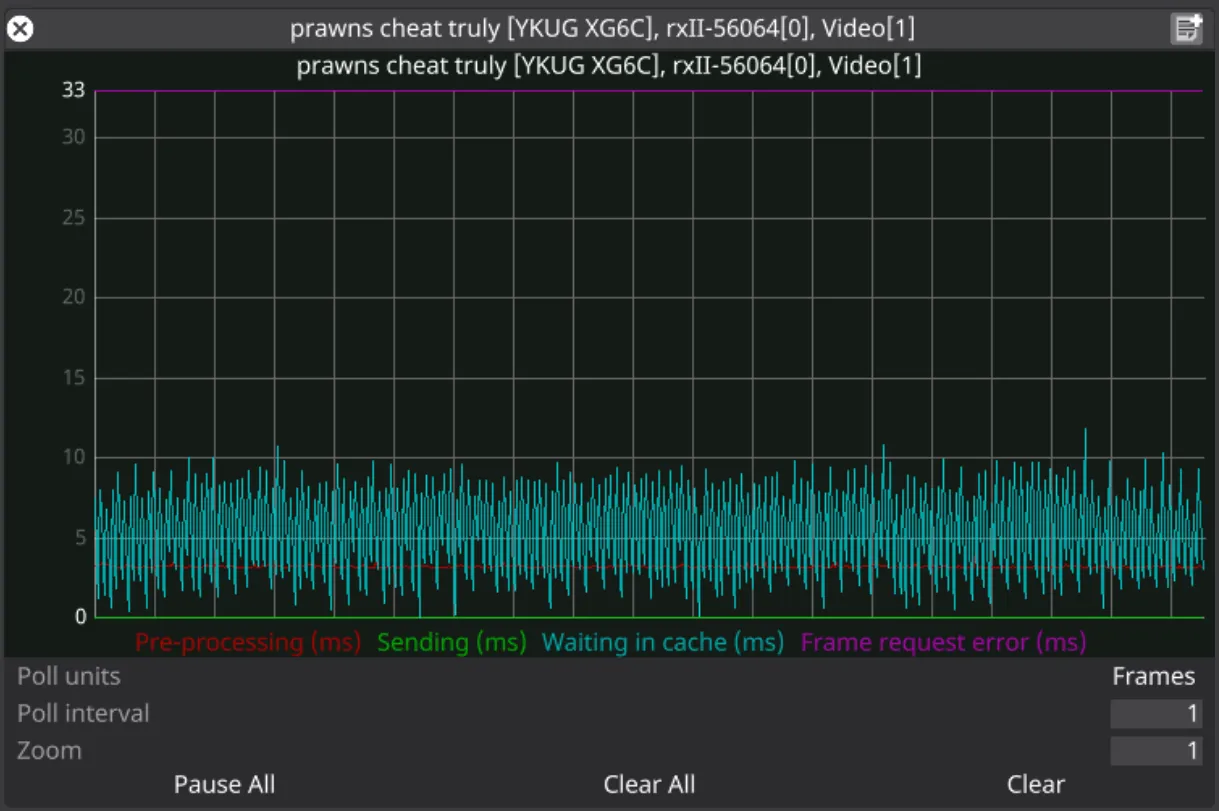
What is it?
Section titled “What is it?”This graph is shown for every texture parameter stream. It shows the latency of texture parameters on their trip to the render nodes.
Pre-processing (ms)
Section titled “Pre-processing (ms)”Amount of time spent preparing the texture for sending on the controller machine.
Sending (ms)
Section titled “Sending (ms)”Amount of time the sender took to dispatch the texture to the network card on the controller machine.
Waiting in cache (ms)
Section titled “Waiting in cache (ms)”Amount of time the texture parameter spent waiting to be processed by the render engine on the render node.
Frame request error (ms)
Section titled “Frame request error (ms)”Difference between the current frame request timestamp, and the texture parameter timestamp that the render engine is using for this frame.
In practice, this error tends to be the sum of the latency accumulated during all previous stages of the texture parameter pipeline, including the actual network transmission time.
How do I use it?
Section titled “How do I use it?”Texture parameters experience additional latency on top of the regular stream latency (see Stream graph). The texture parameter latency graphs reveal this additional latency and can be used to diagnose network or processing performance issues specifically relating to texture parameters.