Vectorscope
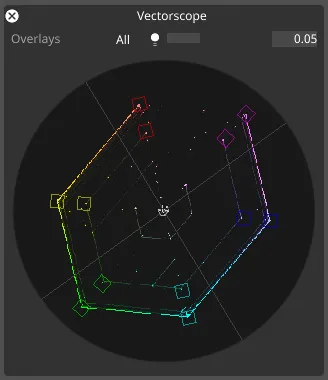
The Vectorscope plots the chroma of the image. Chroma is the colour information that is left when you remove the luma. This would typically be used to confirm colour accuracy against known test patterns, or to colour correct images objectively.
Vectorscope Overlays
Section titled “Vectorscope Overlays”The Vectorscope has two overlays that can be combined or used separately:
- RGBCMY - red, green, blue, cyan, magenta, and yellow markers at 75% or 100% saturation
- IQ lines - aka the “skin tone” line, which can be used to correct skin tones
Workflows
Section titled “Workflows”To open the Vectorscope on an Output
Section titled “To open the Vectorscope on an Output”- Open the Feed Output window by clicking on Feed in the d3 dashboard.
- Right-click on the border of an output to open the Output Properties window.
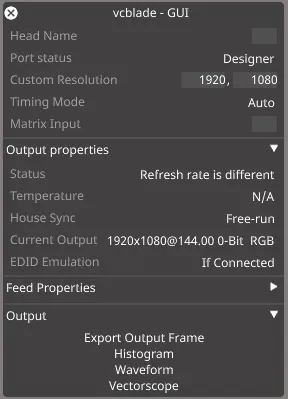
- Click on Vectorscope in the Output tab.
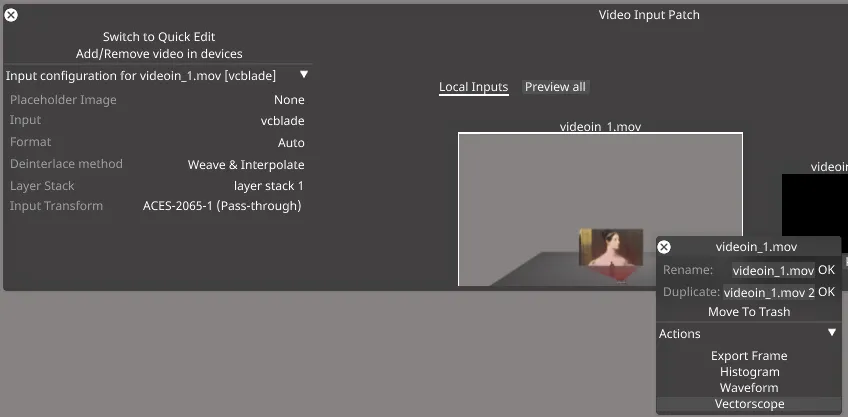
The Vectorscope may also be opened on a video input by opening the Video Input Patch Editor and then right-clicking on a local input’s thumbnail.
How to use Vectorscope
Section titled “How to use Vectorscope”This graph is a circular UV plot indicating where each additional pixel hitting at the same point additively increases intensity.