Grafana LiveUpdate Plugin
The Grafana LiveUpdate plugin enables real-time streaming of Disguise performance metrics and system data to Grafana dashboards using Grafana Live’s WebSocket-based streaming capabilities.
Built to leverage the Live Update web sockets introduced in Disguise r31.0, this plugin provides seamless integration with Grafana’s observability platform, allowing teams to monitor their Disguise systems in real-time alongside other infrastructure metrics.
 Click on the image to watch the video demo in YouTube.
Features
Section titled “Features”- Real-time streaming of Disguise metrics to Grafana dashboards.
- WebSocket-based live data updates with sub-second latency.
- Integration with Grafana Live streaming API.
- Support for custom metric collections and alerting.
- Historical data retention and analysis capabilities.
- Multi-machine monitoring in distributed setups.
- Custom dashboard templates for Disguise workflows.
- Compatible with Disguise r31 and newer.
Install the Plugin
Section titled “Install the Plugin”System Requirements: The Grafana LiveUpdate plugin requires Disguise r31 or newer and a Grafana instance with Live streaming enabled.
To install this plugin:
- Ensure you are running Disguise r31 or newer, and have Docker installed on your computer.
- Download the Grafana LiveUpdate plugin package from the Designer Plugin Gallery.
- Unzip the plugin.
- Double-click the “start grafana” batch script.
- Open Designer.
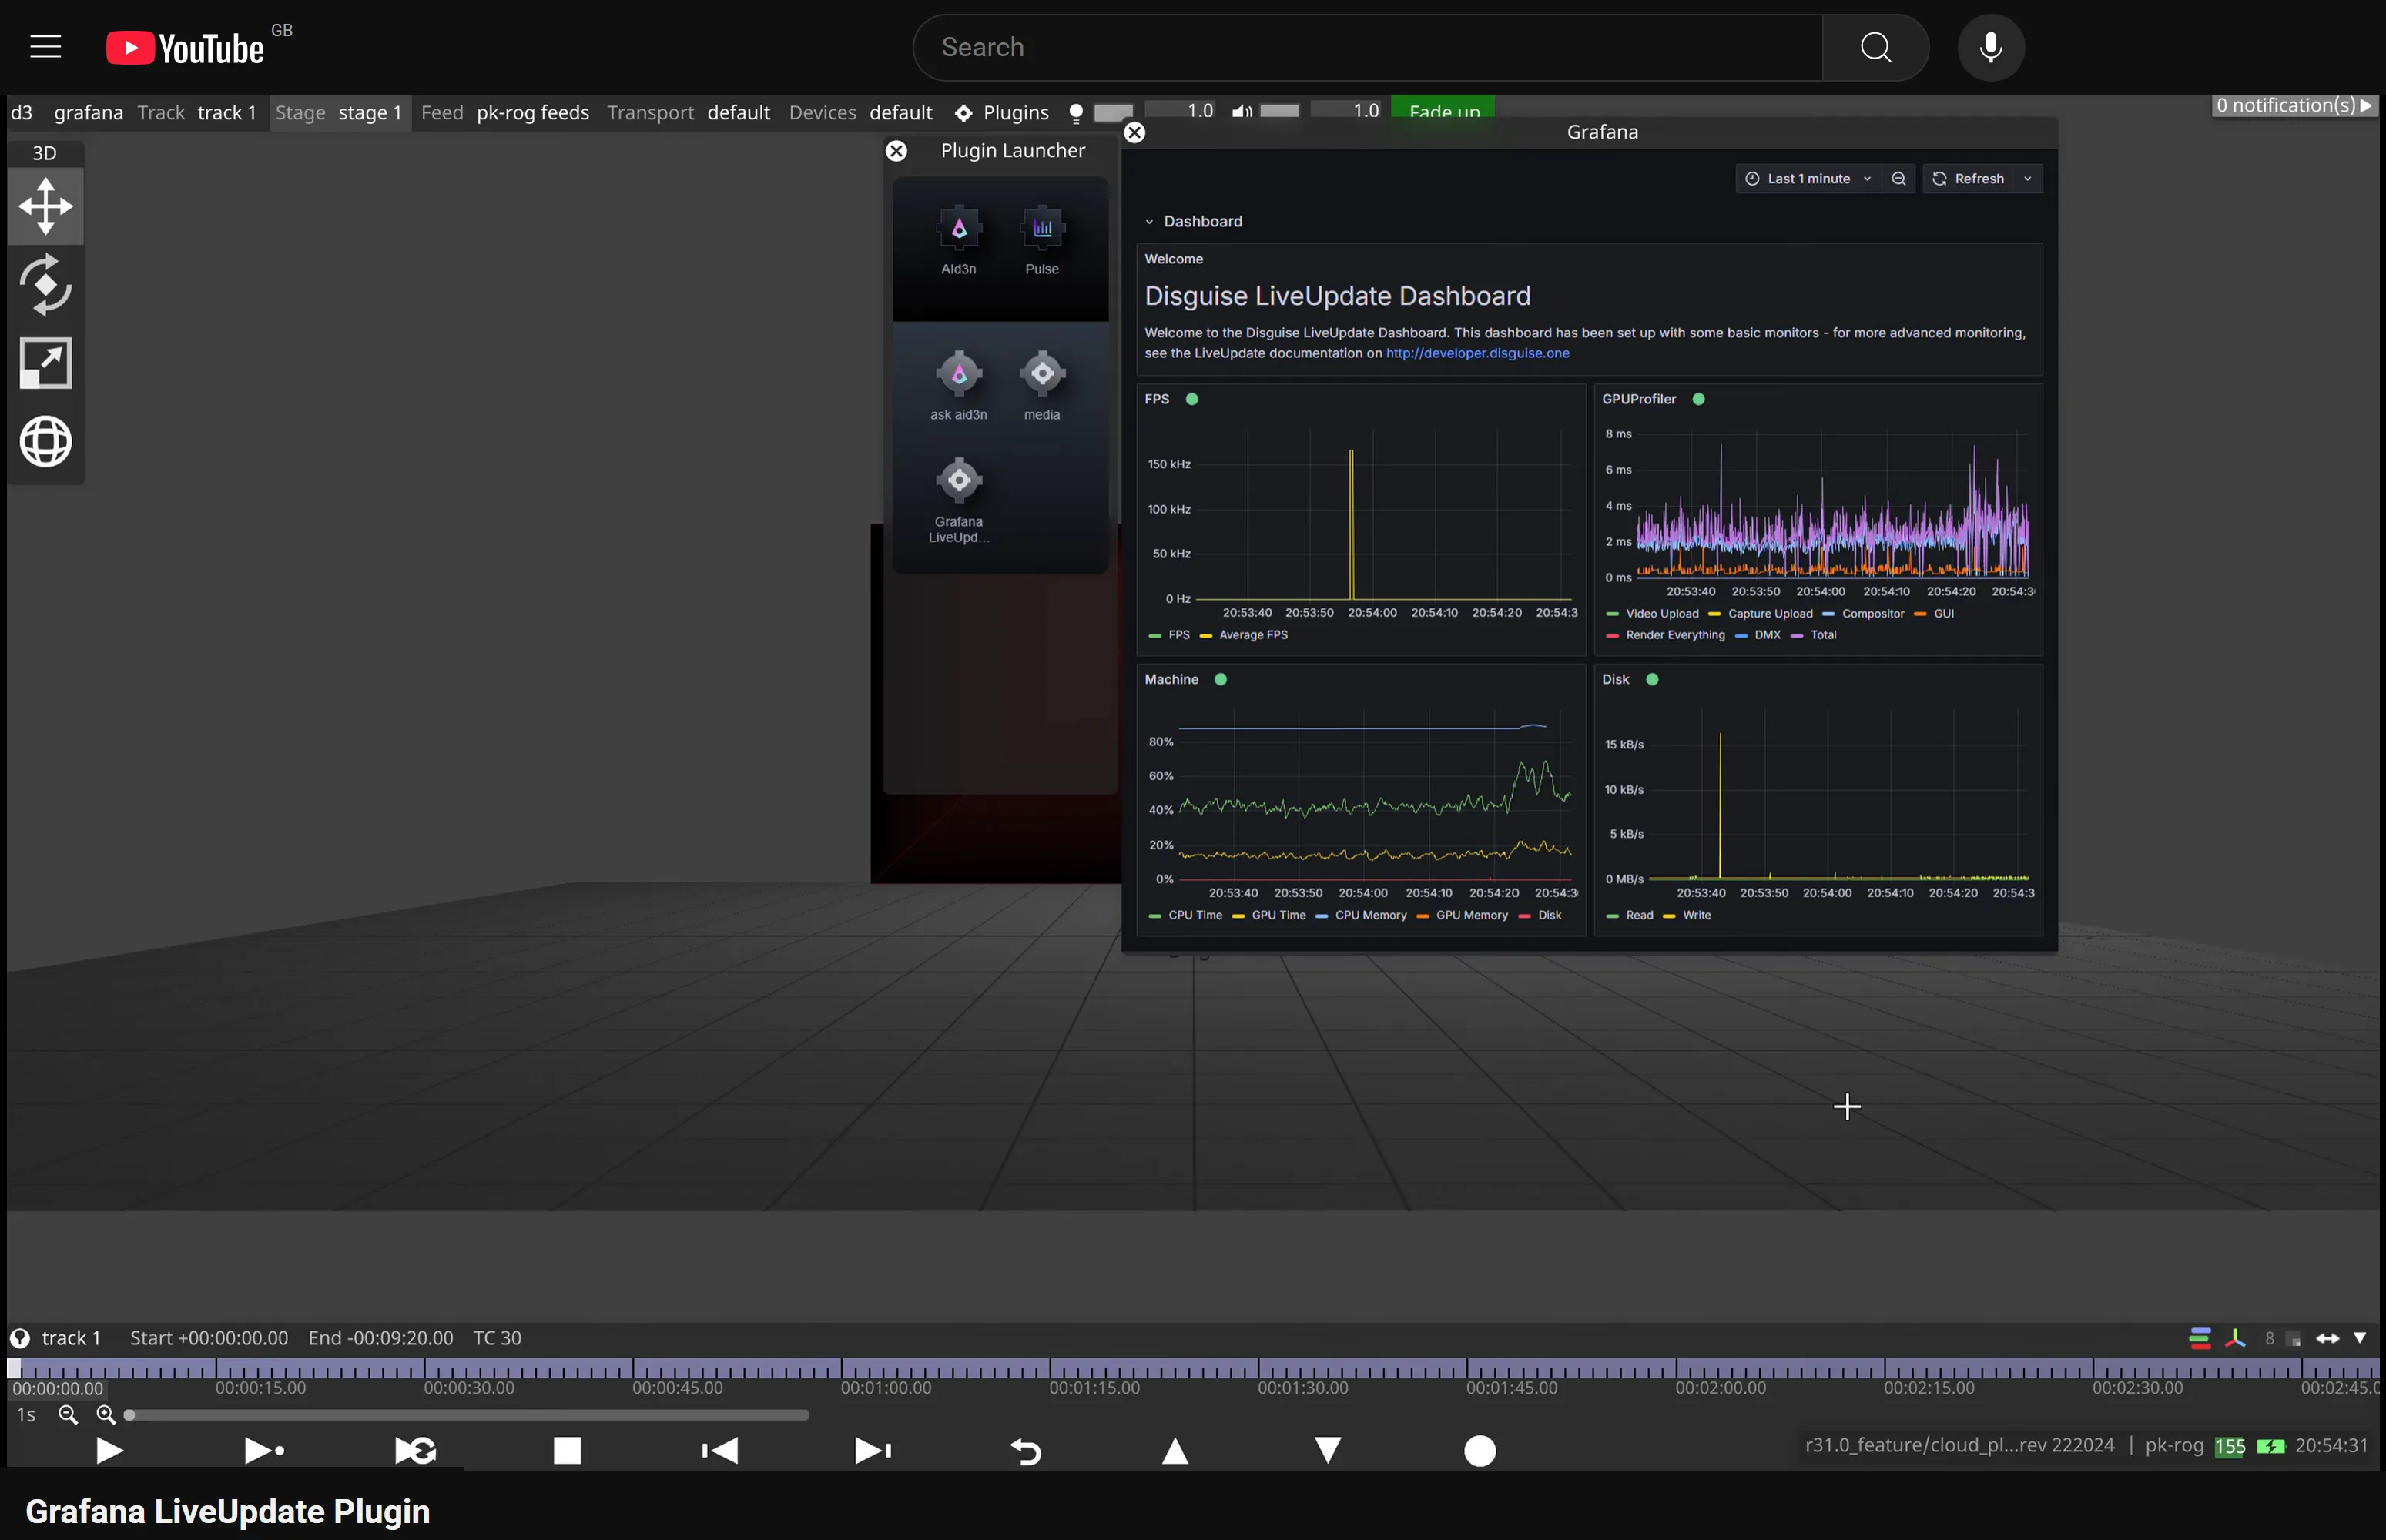
- Click Plugins to access the Plugin Launcher.
- Click Grafana LiveUpdate to open the plugin and view graphs.
After installation, you can open your web browser at http://localhost:3030 and configure the DataSource connection settings to point to your director IP if you’re not running it on the same machine.
Monitor System Performance
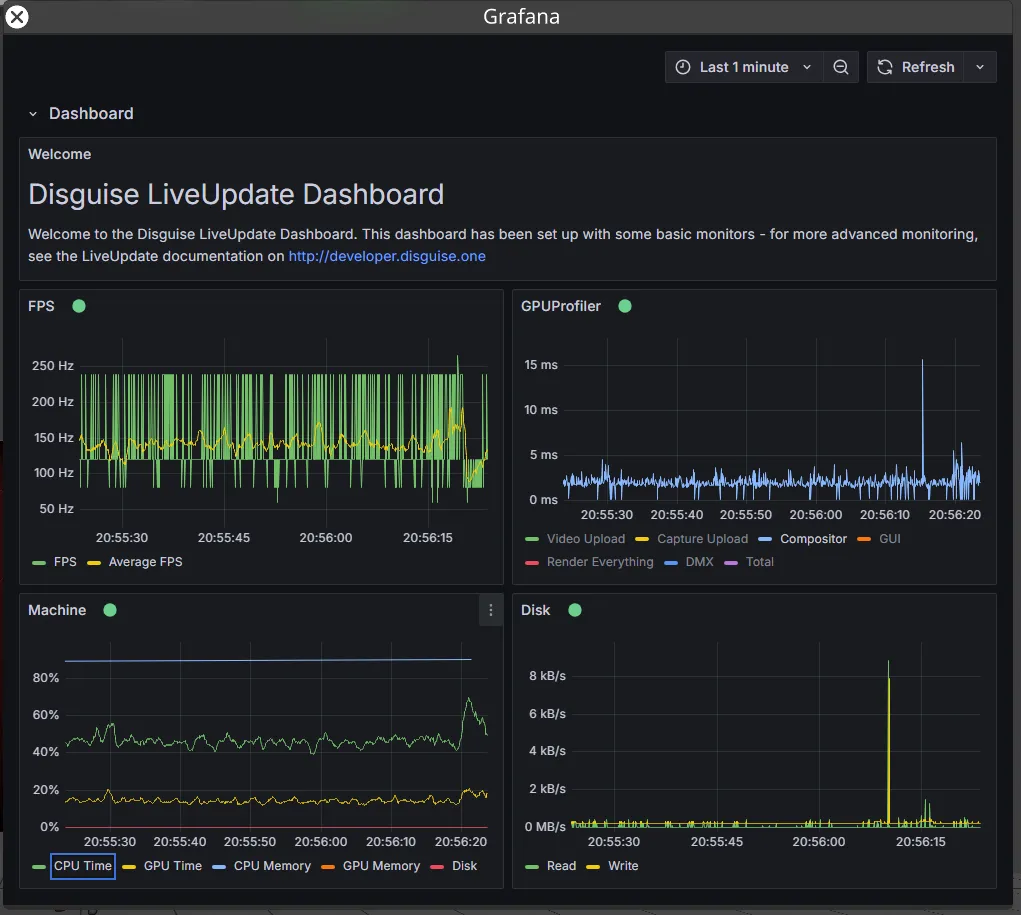
Section titled “Monitor System Performance”- Access your Grafana dashboards to view real-time Disguise metrics.
- View streaming data including:
- CPU and GPU utilisation.
- Memory usage and allocation.
- Frame rate and rendering performance.
- Network throughput and latency.
- Create custom dashboards for specific monitoring needs.
Multi-Machine Monitoring
Section titled “Multi-Machine Monitoring”The Grafana LiveUpdate plugin supports monitoring multiple Disguise machines from a single Grafana instance, providing centralised visibility across distributed setups and show networks.
Best Practices
Section titled “Best Practices”- Use Grafana’s templating features to create reusable dashboards.
- Implement proper data retention policies to manage storage costs.
- Set up regular health checks for the streaming connection.
- Monitor the plugin’s own performance impact on the Disguise system.
- Use Grafana’s annotation features to correlate events with performance data.
Release Notes
Section titled “Release Notes”Grafana LiveUpdate Plugin v1.0.1
Section titled “Grafana LiveUpdate Plugin v1.0.1”- Initial release of the Grafana LiveUpdate Plugin.
- Real-time streaming of Disguise performance metrics using WebSocket.
- Integration with Grafana Live API.
- Support for multi-machine monitoring from a single Grafana instance.
- Includes custom dashboard templates and alerting features.