Capture Latency Methodology
This document outlines the test setup and methodology that Disguise uses to measure the video capture latency of its products.
The measurements are conducted on the currently available and supported products in the Disguise catalog.
The trend of data recorded since r15.1.2 will be used to determine the expected results and ensure that no regression of functionality has occurred.
Latency is measured as a quantity of frames at the current refresh rate. Conversion to milliseconds can be performed with this equation:
(Number of frames of latency x (1 / refresh rate)) x 1000
Variables and considerations
Section titled “Variables and considerations”When testing there are a number of variables that are accounted for to achieve accurate and insightful results:
-
The global latency mode, which affects the number of buffered frames the software keeps on the graphics card. A larger buffer typically ensures smoother playback.
-
The input latency mode - Disguise buffers incoming video to ensure smooth playback of video input. The number of frames of delay affects latency.
-
The project refresh rate. Frames at lower refresh rates represent a larger fraction of a second than at higher refresh rates, so the software has more time to complete frame-bound operations.
-
For the test, frame blending, skipping, or doubling must be avoided at all costs by matching the content frame rate to the global refresh rate.
Global latency modes
Section titled “Global latency modes”Global latency modes affect the number of buffered frames that Disguise stores on graphical memory before outputting them. These buffered frames help absorb sudden spikes in rendering time to avoid visible frame drop. The trade-off is that the latency increases with the number of buffered frames.
- In normal mode Disguise buffers 2 frames before outputting.
- In low latency mode Disguise buffers 1 frame before outputting.
- In ultra low latency mode Disguise does not buffer any frames.
Input latency modes
Section titled “Input latency modes”As with output, Disguise buffers incoming video both to absorb spikes in render time and to deal with variation or mismatches in input timing, refresh rate.
By default, Disguise delays incoming video by one frame in order to ensure smooth playback across inputs.
This figure can be adjusted using the smoothVideoInputFramesDelay options switch.
Content
Section titled “Content”Test content is rendered as TIFF sequences. This is done for the sake of quality control – every frame can be individually checked in the event of manual investigation.
There is one image sequence per refresh rate. Each sequence is 90 frames long to keep the test project as portable as possible. The test script is able to account for scenarios where the frame numbers “wrap around” within a comparison.
Methodology / Environment
Section titled “Methodology / Environment”The test has been constructed to be completely self-contained, only relying on Disguise hardware and software, removing potential uncertainties introduced by third party equipment.
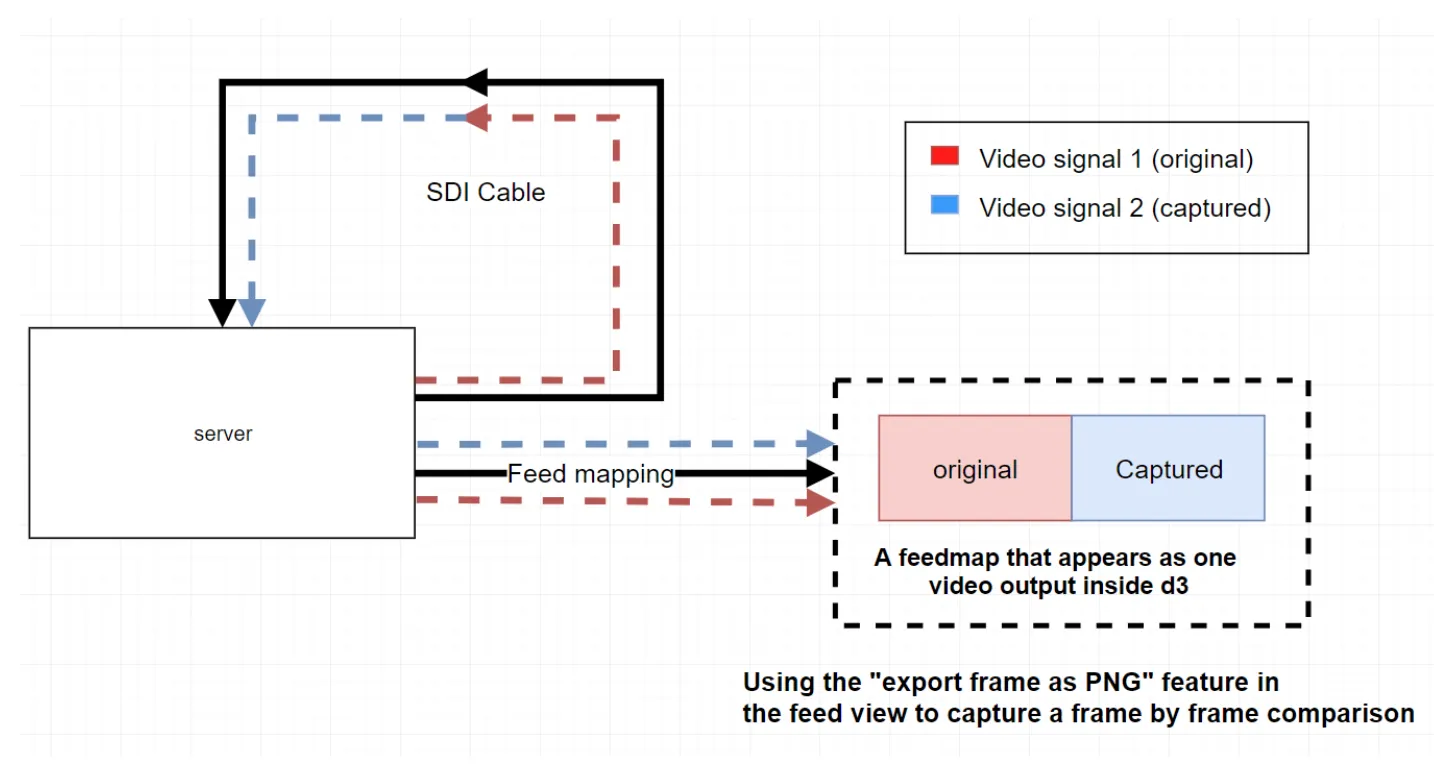
The system being tested outputs from an SDI VFC card into its own SDI capture card. The captured signal gets composited inside a feed map alongside the source video and a frame is exported for analysis.

This process is automated using a script in the Disguise internal test script library. It is intended to interface with a specially designed Disguise project, and covers 60, 59.94, 50, 30 and 29.97 Hz configurations. Each latency mode: Normal, Low, and Ultra Low, is sampled at least 5 times for each refresh rate.
Note that the DisplayPort to SDI conversion inside the SDI VFC card itself incurs 7 lines of delay, but this is considered negligible within the scope of this test.
The comparison between source and captured image is achieved using specially designed content:

In this latency test sample, the original video is on the left and the captured video on the right. The frame counter at the moment this snapshot was taken is at 53 frames and the counter for the captured video is at 49 frames. The difference between the two demonstrates that the system has 4 frames of latency between being output by the GPU, traveling through the capture system, and once again appearing on the screen inside Disguise.
The automated test script is able to compare the two halves of this sample using image analysis of a binary “barcode”, visible on the extreme left of each half of the image – the barcode is only up to 16 pixels across, which is why it appears as a white line in this illustration. This is done for each sample of each latency mode of each refresh rate.
Capturing and compiling data
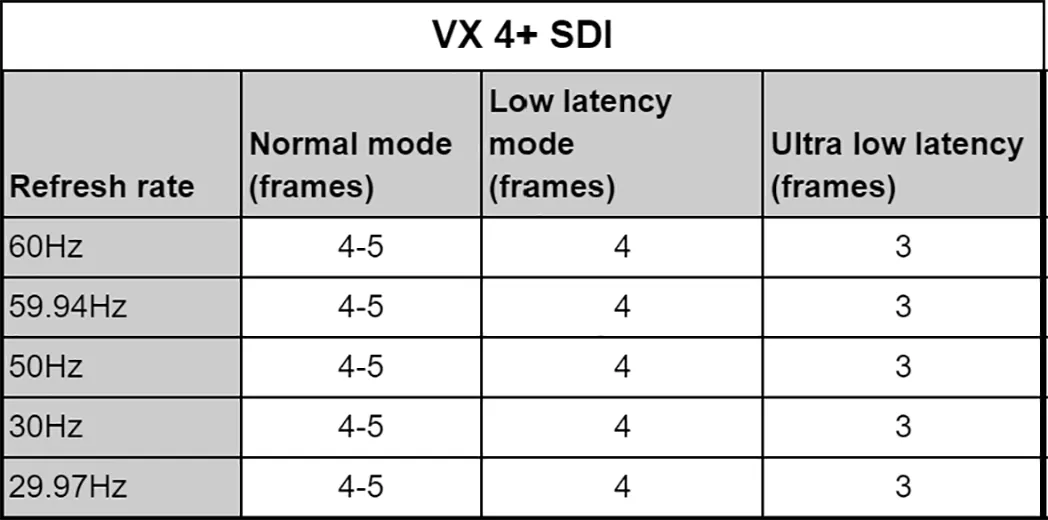
Section titled “Capturing and compiling data”The average of each sample set is discovered and the resulting 12 data points are tabulated.
This is an example of some results for the VX 4+.

Exceptions/limitations
Section titled “Exceptions/limitations”The solo has options for SDI capture but does not support VFC cards. The test can still be carried out using in-house tooling, but is not replicable externally. Only the SDI capture option has been measured in this way, and findings show similar performance to the gx1 (with which it shares its underlying SDI capture hardware).
Additional notes
Section titled “Additional notes”The original version of this test (circa r15.1.2) was only able to compare a single capture input against the video source. The test has since been updated to compare up to 4 capture inputs with the source and with each other.
The test now also checks for tearing on the capture inputs.
All input signals the capture card receives in this test are progressive, and Level-A when using 3G-SDI.
Modifying the current methodology for measuring latency with NDI®
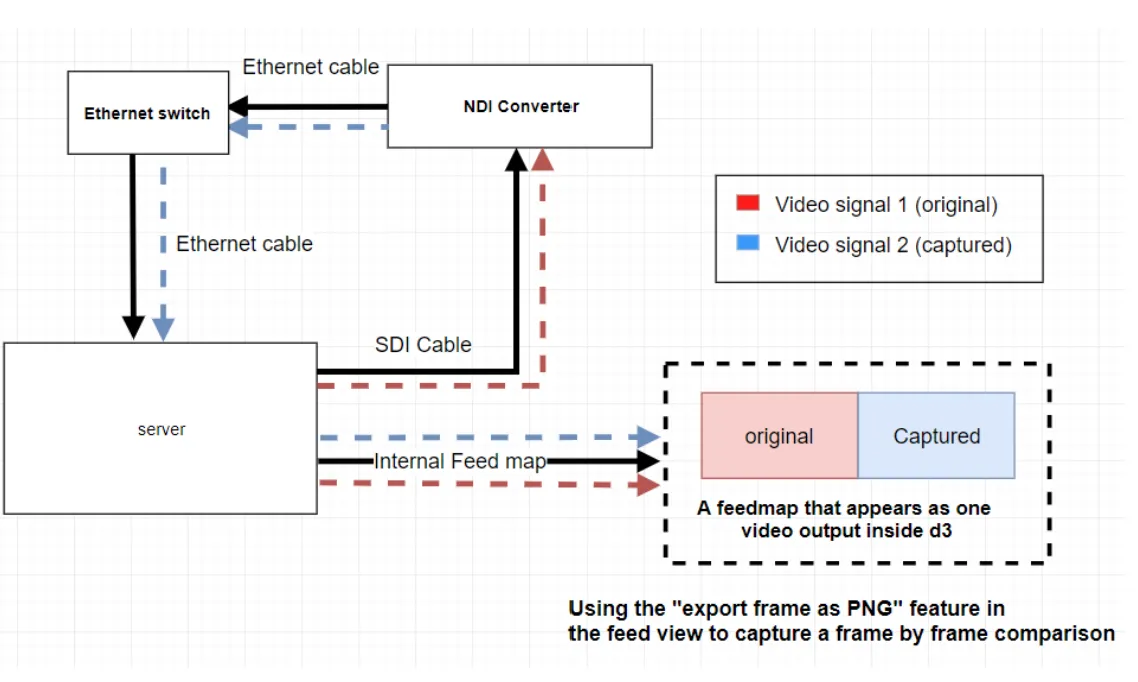
Section titled “Modifying the current methodology for measuring latency with NDI®”This test can be modified to measure NDI® capture latency as well, with the inclusion of a third-party converter.

The converter used is the Birddog Studio 2, which has a claimed latency of 1 frame when converting from SDI to NDI®.