OpenVPCal プラグイン - リファレンス
このページでは、OpenVPCal プラグインインターフェースの包括的なリファレンスドキュメントを提供します。プラグインの各タブ(Main タブ、Analyse タブ、Settings タブ)で利用できるすべてのコントロール、設定、機能を網羅しています。
各コントロールの役割、キャリブレーション分析グラフの解釈方法、特定のワークフロー向けの OpenVPCal 設定の構成方法を理解するために、このリファレンスを使用してください。手順については クイックスタートガイド を、最適なセットアップの推奨事項については ベストプラクティスガイド を参照してください。
System Tray(システムトレイ)
Section titled “System Tray(システムトレイ)”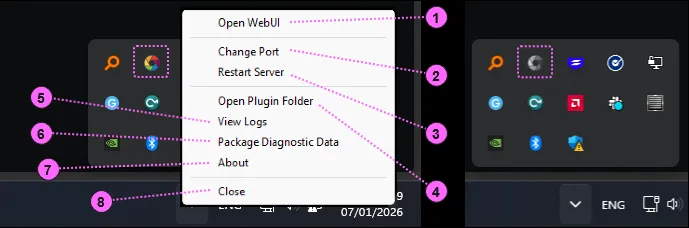
OpenVPCalPlugin.exe を起動すると、システムトレイにアイコンが表示されます。アイコンの色はサーバーの状態を示します。
- 色付きアイコン: サーバーが正しく実行されています(OpenVPCal Plugin System Tray の左側)。
- グレーアウトしたアイコン: サーバーが失敗または実行されていません(OpenVPCal Plugin System Tray の右側)。
サーバーの起動に失敗した場合、ポートの競合が最も可能性の高い原因です。これを解決するには、Change Port を使って別のポート番号を割り当てます。
- Open WebUI:
- 既定のブラウザで OpenVPCal Plugin の WebUI を開きます。通常のワークフローでは、Plugin ウィジェットを介して Designer 内の OpenVPCal Plugin UI を操作します。ただし、Designer が別のマシンで実行されている場合は、WebUI を開いてネットワーク経由で Designer を操作できます。
- Change Port:
- サーバーが実行されていない場合(グレーアウトしたアイコン)、OpenVPCal Plugin と別のアプリケーションとの間でポートが競合している可能性が高いです。Change Port を使って別のポート番号を割り当てます。OpenVPCal Plugin サーバーは新しいポートで自動的に再起動します。
- Restart Server:
- ポート競合以外の理由でサーバーが失敗した場合は、このオプションを使って同じポート番号でサーバーを再起動します。
- Open Plugin Folder:
- キャリブレーション関連のすべての設定とアセットを含むフォルダーを開きます。
- View Logs:
- 既定のテキストエディターでログファイルを開きます。
- Package Diagnostic Data:
- トラブルシューティング用の診断データを含む、タイムスタンプ付きの
.zipアーカイブファイルを作成します。 - パッケージ化されたデータは次の場所に保存されます。
Documents/d3plugins/diag_openvpcal_<timestamp>.zip。
- トラブルシューティング用の診断データを含む、タイムスタンプ付きの
- About:
- プラグインのバージョンを表示します。
- Close:
OpenVPCalPlugin.exeを終了します。
Landing Page(ランディングページ)
Section titled “Landing Page(ランディングページ)”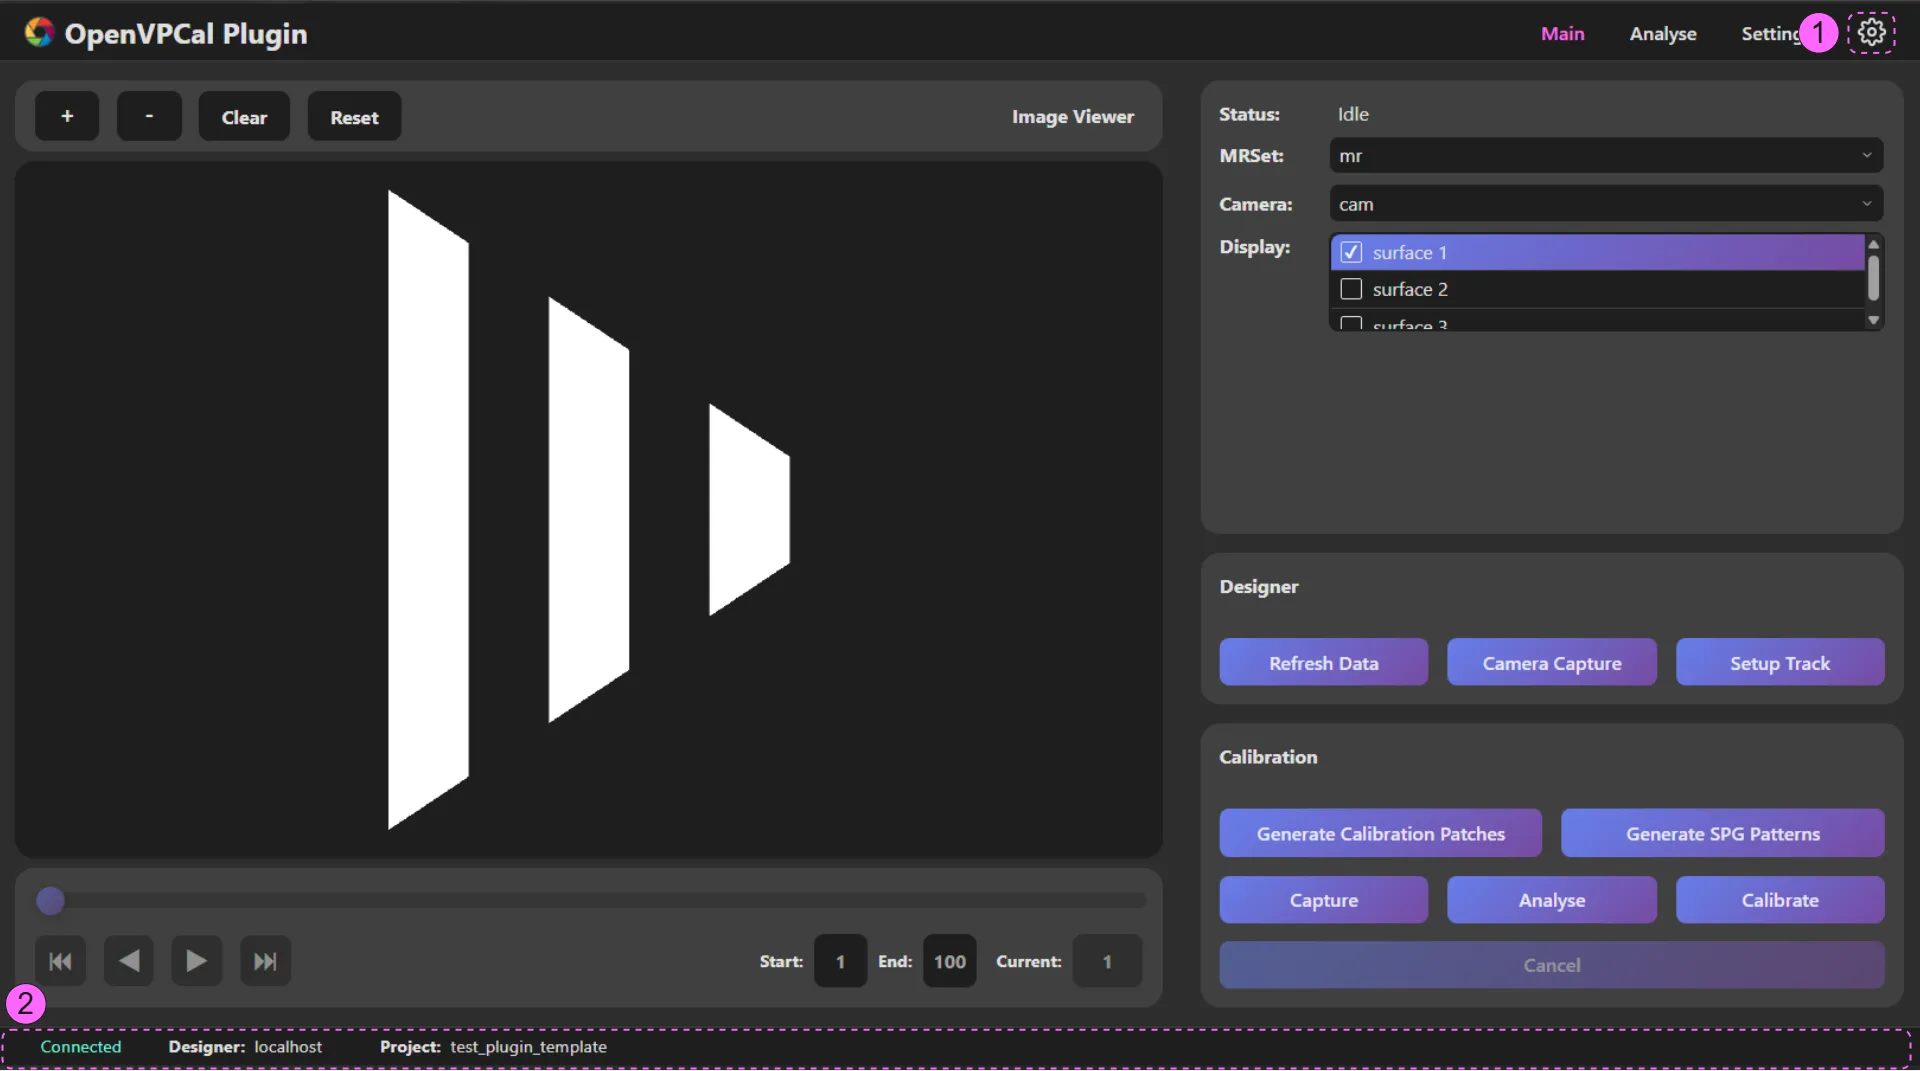
1. Settings(設定)
Section titled “1. Settings(設定)”設定アイコンをクリックすると、プラグイン設定ウィジェットが表示されます。
Designer IP Address
Section titled “Designer IP Address”OpenVPCal プラグインが Designer セッションネットワークに接続されたサーバーやラップトップで実行されている場合、IP アドレスを割り当てる必要はありません。プラグインはセッション内の Director を検出して接続を確立できます。ただし、OpenVPCal Plugin が別のネットワークで実行されている場合は、プラグインがセッションを検出して接続を確立できるよう、IP アドレスを Director の IP アドレスに設定する必要があります。
Designer Port
Section titled “Designer Port”これは Designer の HTTP ポートです。ポートは d3 Manager で確認できます。
Machine Settings > Advanced Network Configuration > HTTP Port(既定: 80)
Rsync Port
Section titled “Rsync Port”OpenVPCal Plugin が Windows で実行されている場合、キャリブレーション処理のファイル転送には Windows ファイルシステムが使用され、rsync は使用されません。ただし、OpenVPCal Plugin が Linux または Mac で実行されている場合は、これを正しく構成する必要があります。rsync ポートは Designer の rsync デーモンポートと同一でなければなりません。ポートは d3 Manager で確認できます。
Machine Settings > Advanced Network Configuration > rsync daemon port(既定: 9993)
Enable All OpenVPCal Settings
Section titled “Enable All OpenVPCal Settings”Designer は、キャリブレーション処理のために一部の OpenVPCal 設定が特定の値であることを想定しています。そのため、Settings タブ の一部の OpenVPCal 設定は、キャリブレーション処理中に問題を引き起こす可能性のある設定の変更を防ぐために無効化されています。すべての OpenVPCal 設定を完全に制御したい場合は、Enable All OpenVPCal Settings をチェックできます。
Update OCIO Config on Capture
Section titled “Update OCIO Config on Capture”Designer は、キャプチャー処理のために事前キャリブレーション設定が選択されていることを想定しています。Update OCIO Config on Capture が有効な場合、プラグインは Capture 開始時に Designer の OCIO 設定を事前キャリブレーション設定に更新します。
2. Status Footer(ステータスフッター)
Section titled “2. Status Footer(ステータスフッター)”ステータスフッターは、接続された Designer の状態を表示します。左から順に次を表示します。
- Connected/Disconnected: プラグインと対象の Designer 間の接続状態。
- Designer: Designer セッションで接続された Director の IP アドレス。
- Project: 接続された Designer セッションの Designer プロジェクト名。
Main Tab(メインタブ)
Section titled “Main Tab(メインタブ)”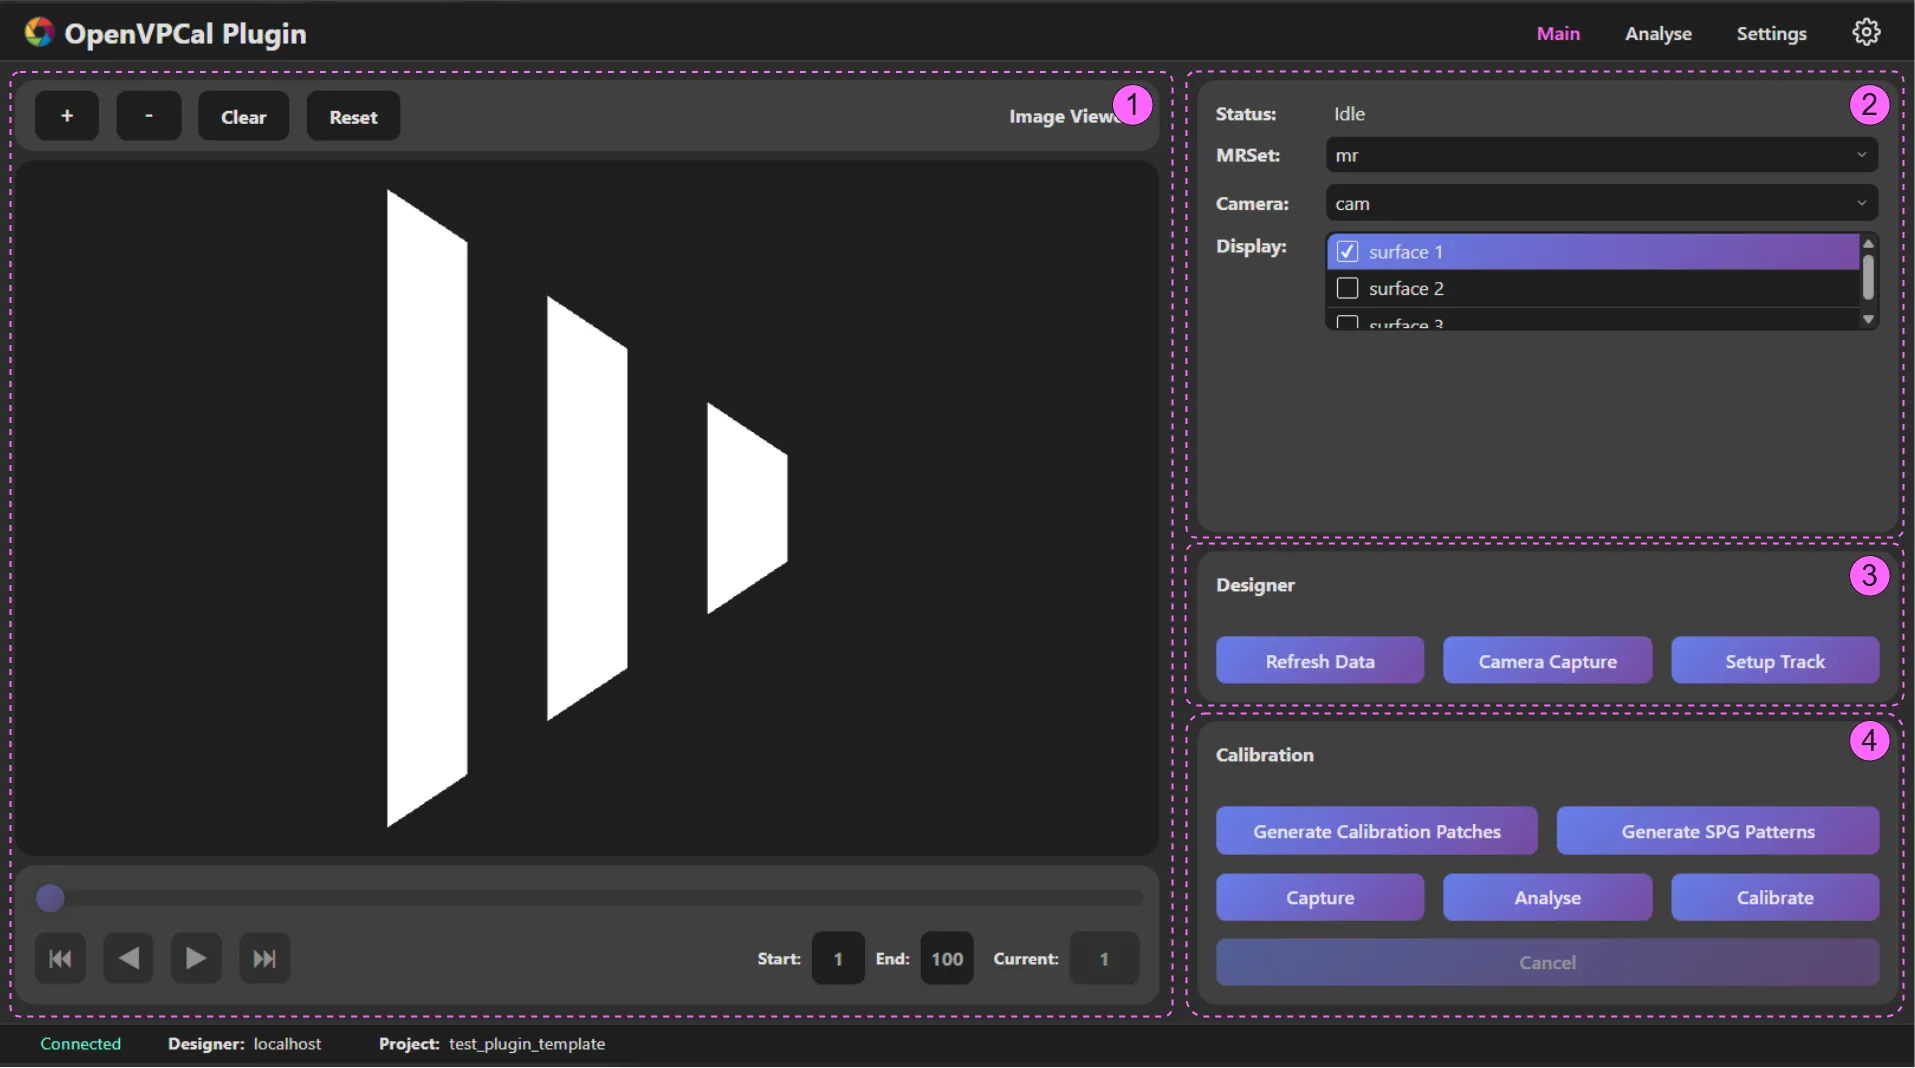
Main Tab の要素
Section titled “Main Tab の要素”1. Main Canvas(メインキャンバス)
Section titled “1. Main Canvas(メインキャンバス)”メインキャンバス領域では、キャプチャーした画像を検査し、キャリブレーションを実行する関心領域(ROI)を描画できます。キャンバスは control、canvas、navigation の 3 つの部分で構成されます。
Canvas Control Panel
Section titled “Canvas Control Panel”ヘッダーには、左側に基本的なキャンバス制御ボタン、右側にステータステキストがあります。ステータステキストは、キャリブレーションキャプチャーが完了すると読み込み状態を表示します。
+ボタン: ズームイン-ボタン: ズームアウト- Clear: キャンバスから ROI をクリア
- Reset: ROI をクリアし、ズームレベルをリセット
Canvas Panel
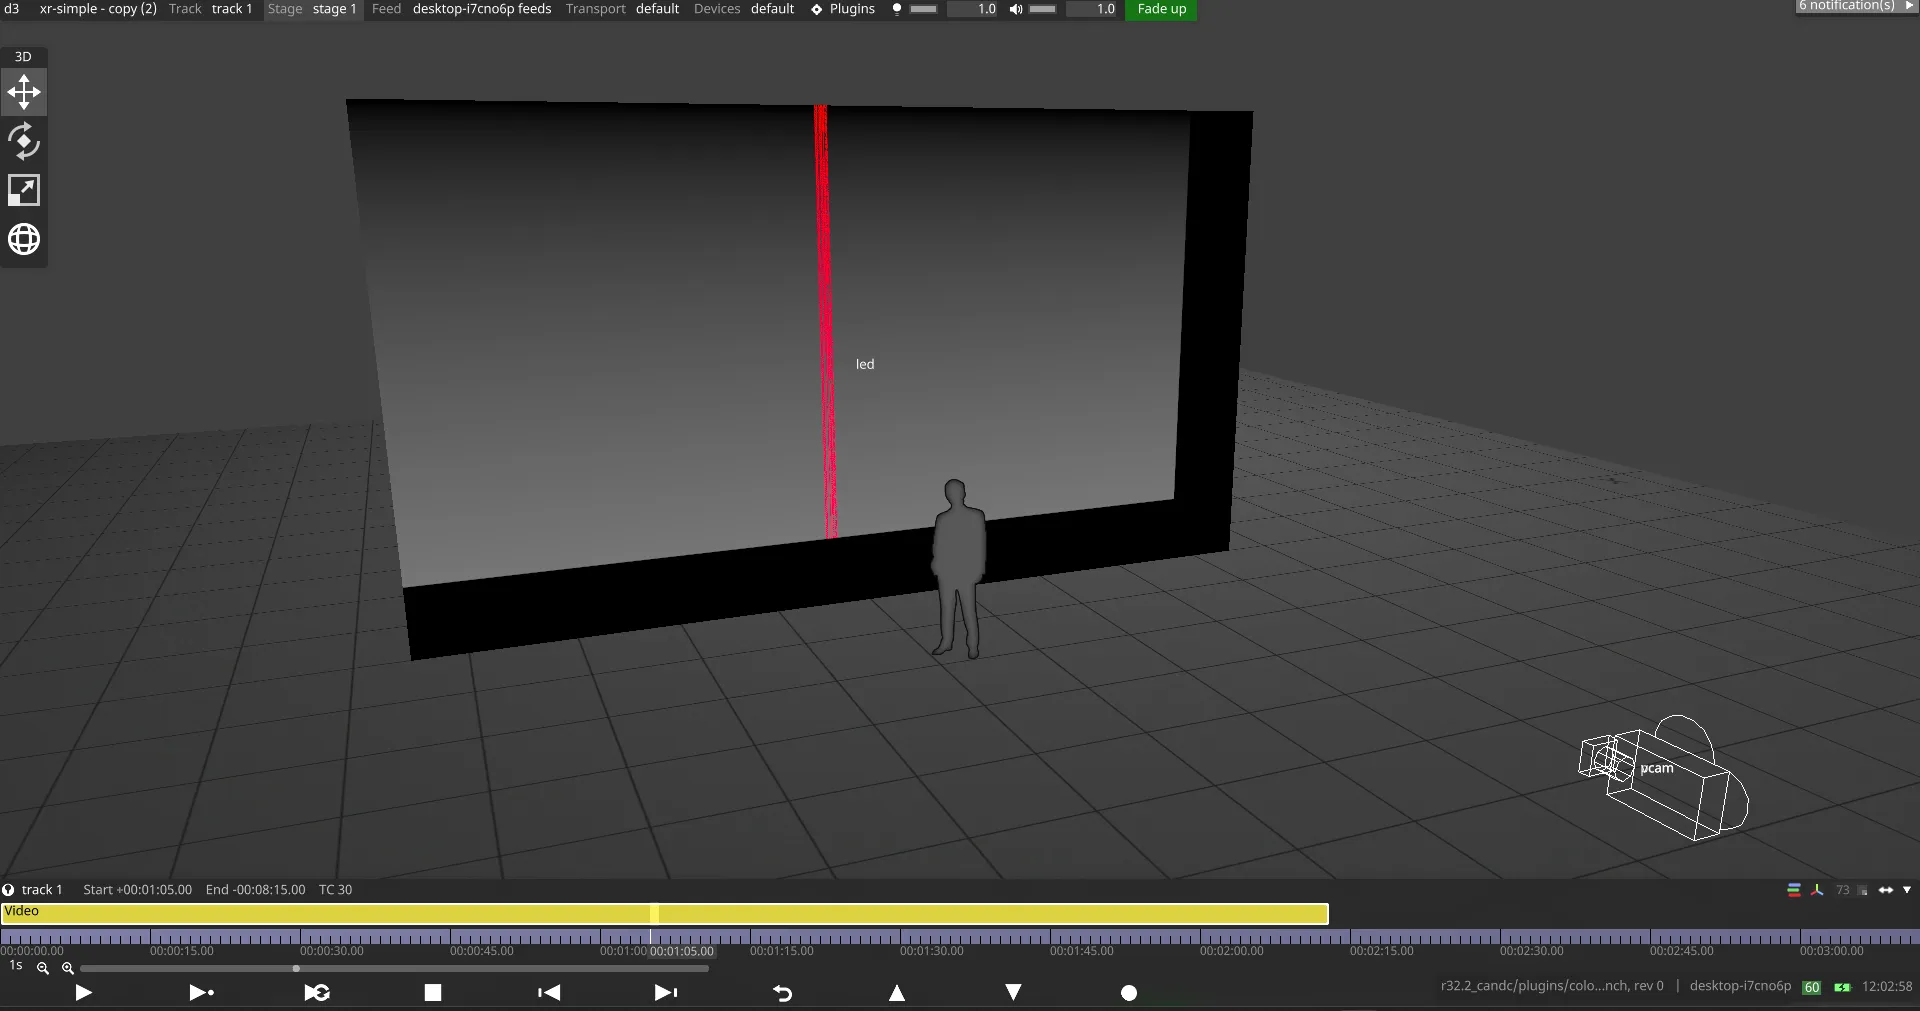
Section titled “Canvas Panel”キャンバスはキャプチャーした画像を表示します。Designer 領域の Camera Capture と Calibration 領域の Capture はどちらもキャンバスに表示される画像を更新します。画像を簡単に検査できるよう、いくつかのマウス操作がサポートされています。
Mouse Control
Section titled “Mouse Control”- 左クリック + ドラッグ: ビューのパン/移動。
- 右クリック + ドラッグ: ROI を描画。
- ホイールアップ: ズームイン。
- ホイールダウン: ズームアウト。
- ホイールクリック(MMB): ズームレベルと位置を既定に戻す。
Navigation Panel
Section titled “Navigation Panel”ナビゲーション領域を使って、メインキャンバスに表示するフレームを制御できます。ナビゲーション領域は、キャリブレーションキャプチャー処理が完了し、キャプチャーした画像が読み込まれると有効になります。
- Playhead: スクラブして表示フレームを素早く変更できます。
- 矢印ボタン: 矢印ボタンで画像を 1 枚ずつ検査できます。
- 二重矢印ボタン: プレイヘッドをシーケンスの先頭または末尾に移動します。
- Start: シーケンスの開始。
- End: シーケンスの終了。
- Current: 現在のフレーム。このフィールドを更新して特定のフレームに移動できます。
2. State Area(状態領域)
Section titled “2. State Area(状態領域)”Status
Section titled “Status”ステータスはプラグインの大まかな状態を表示します。
- Disconnected: Designer が切断されています。
- Running: キャリブレーション処理が実行中です。
- Idle: キャリブレーション処理を実行できる状態です。
MRSet には Designer 内の MRSet のリストが含まれます。ドロップダウンメニューで現在の MRSet を変更すると、Designer 内の現在の MRSet が更新されます。
Camera
Section titled “Camera”Camera には Designer 内のカメラのリストがあります。ドロップダウンでカメラを変更すると、選択した MR Set のカメラが更新されます。
Display
Section titled “Display”Display には、選択した MR Set 向けに選択されたディスプレイのリストがあります。チェックボックスを使って、キャプチャー・分析・キャリブレーションを実行するディスプレイを制御できます。選択・ハイライトされたディスプレイが、メインキャンバス領域でキャプチャーシーケンスの表示に使用されます。
3. Designer Area(Designer 領域)
Section titled “3. Designer Area(Designer 領域)”Refresh Data
Section titled “Refresh Data”OpenVPCal プラグインは Designer の状態をリアルタイムには取得しません。Designer で変更を行った場合は、Refresh Data ボタンを使って Designer の状態を更新する必要があります。
Camera Capture
Section titled “Camera Capture”キャプチャーシーケンスが行われていない場合、Camera Capture を使って Designer からカメラプレビューを取得できます。
Setup Track
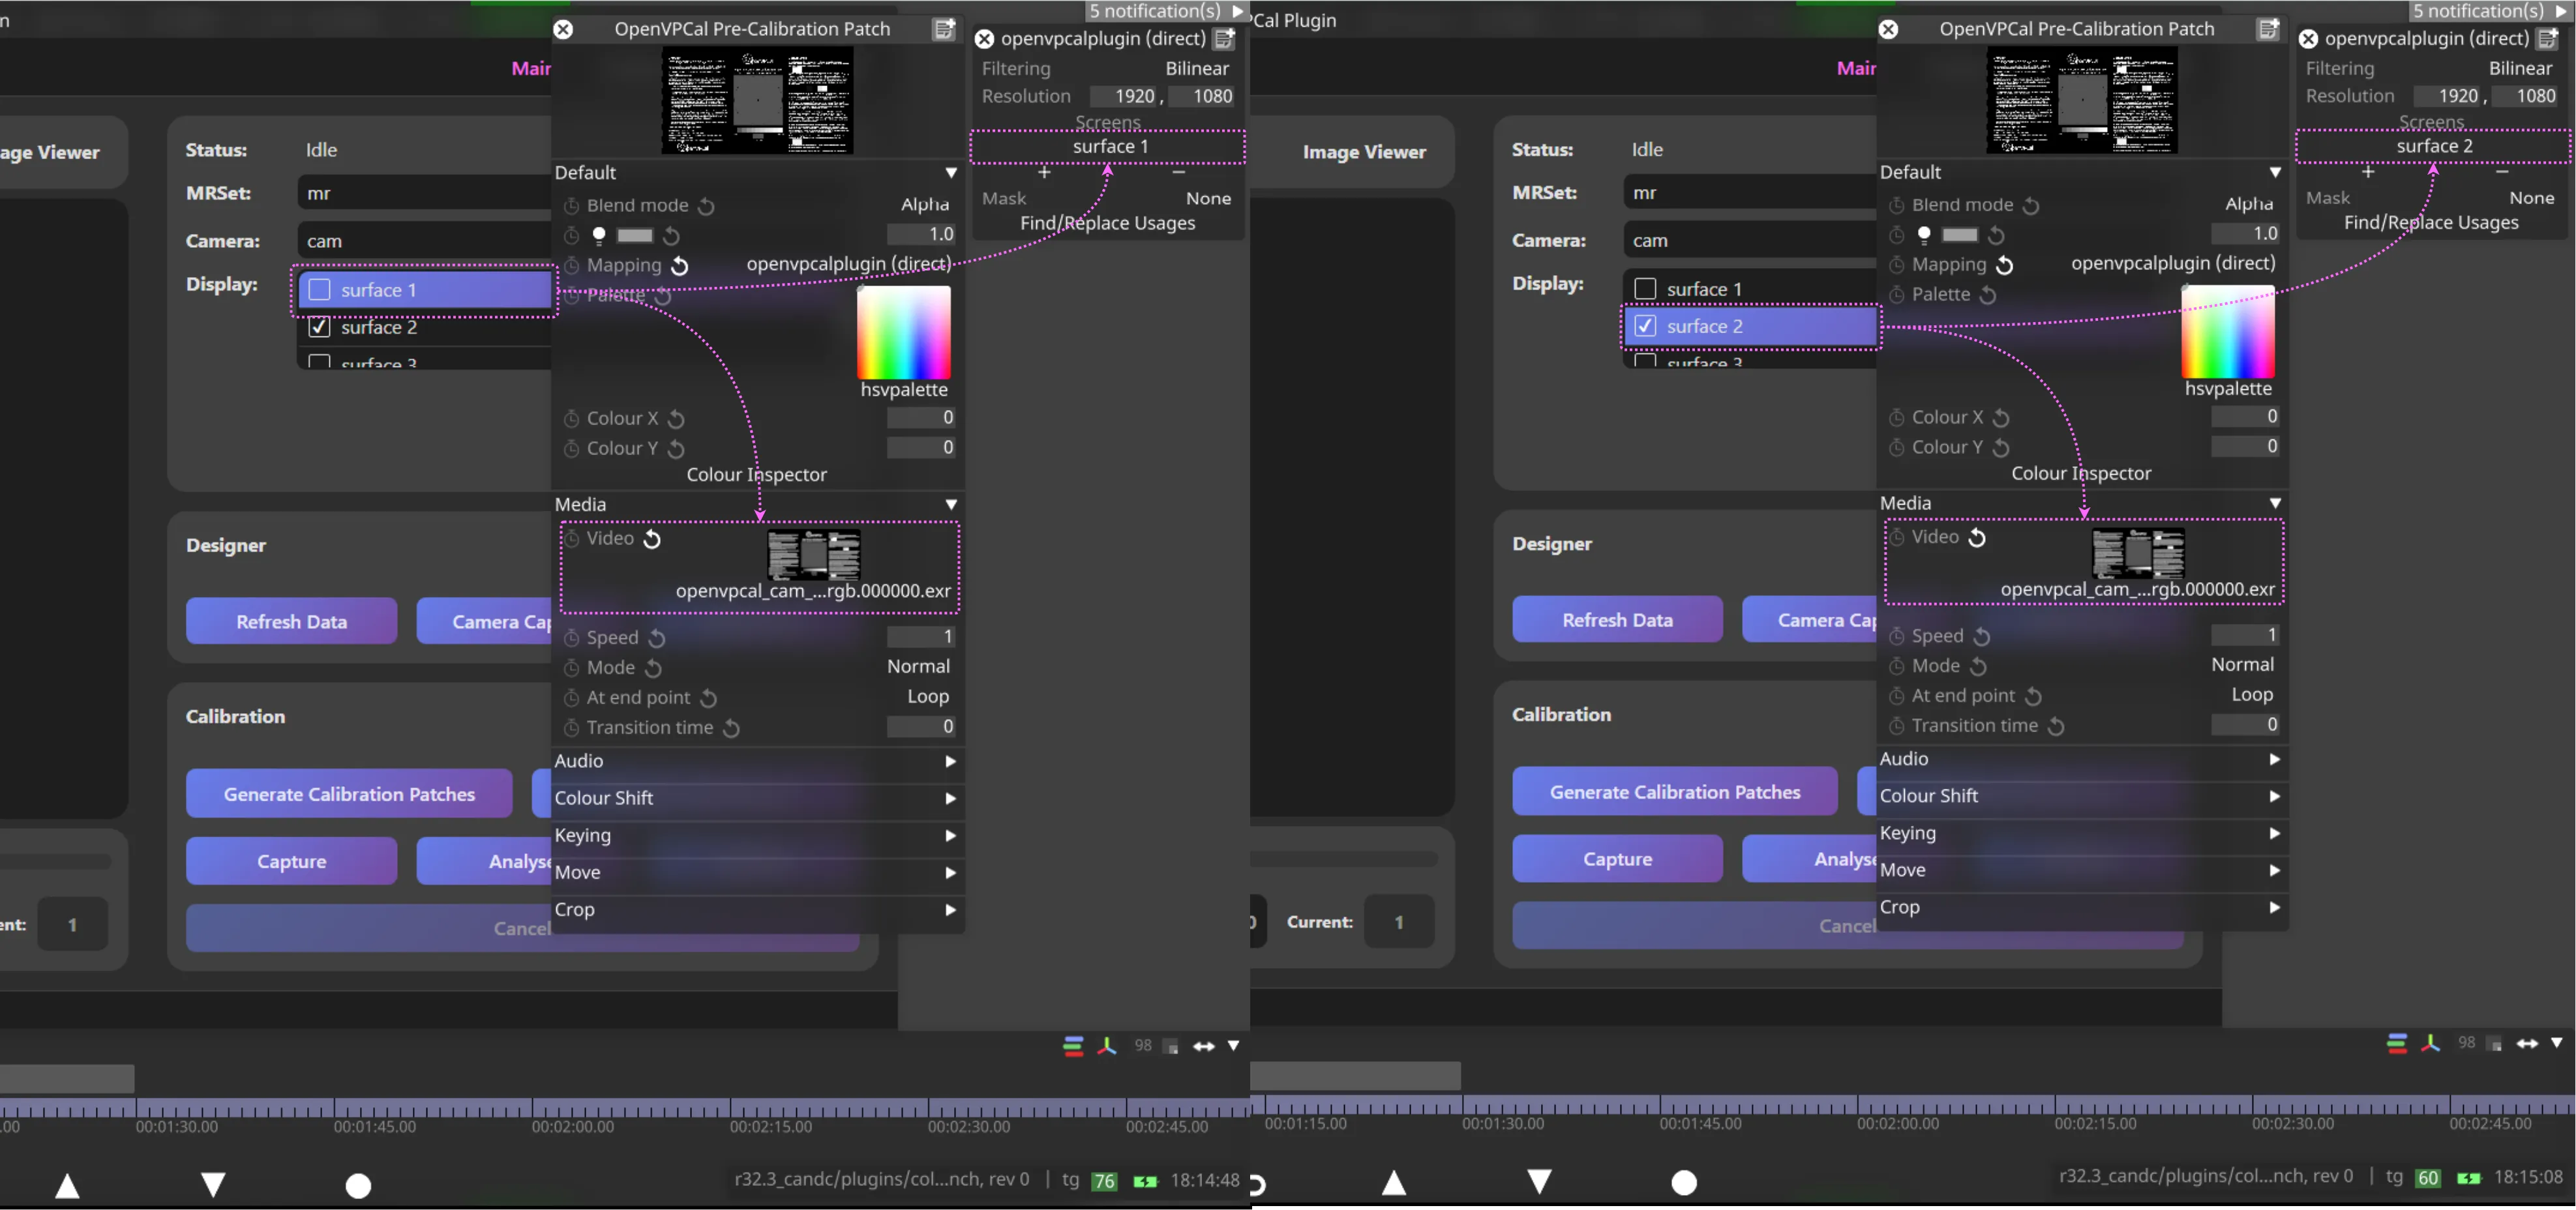
Section titled “Setup Track”キャリブレーション処理用の openvpcal_plugin トラックを作成して切り替え、OpenVPCal Pre-Calibration Patch と OpenVPCal SPG Patterns の 2 つのビデオレイヤーを準備します。
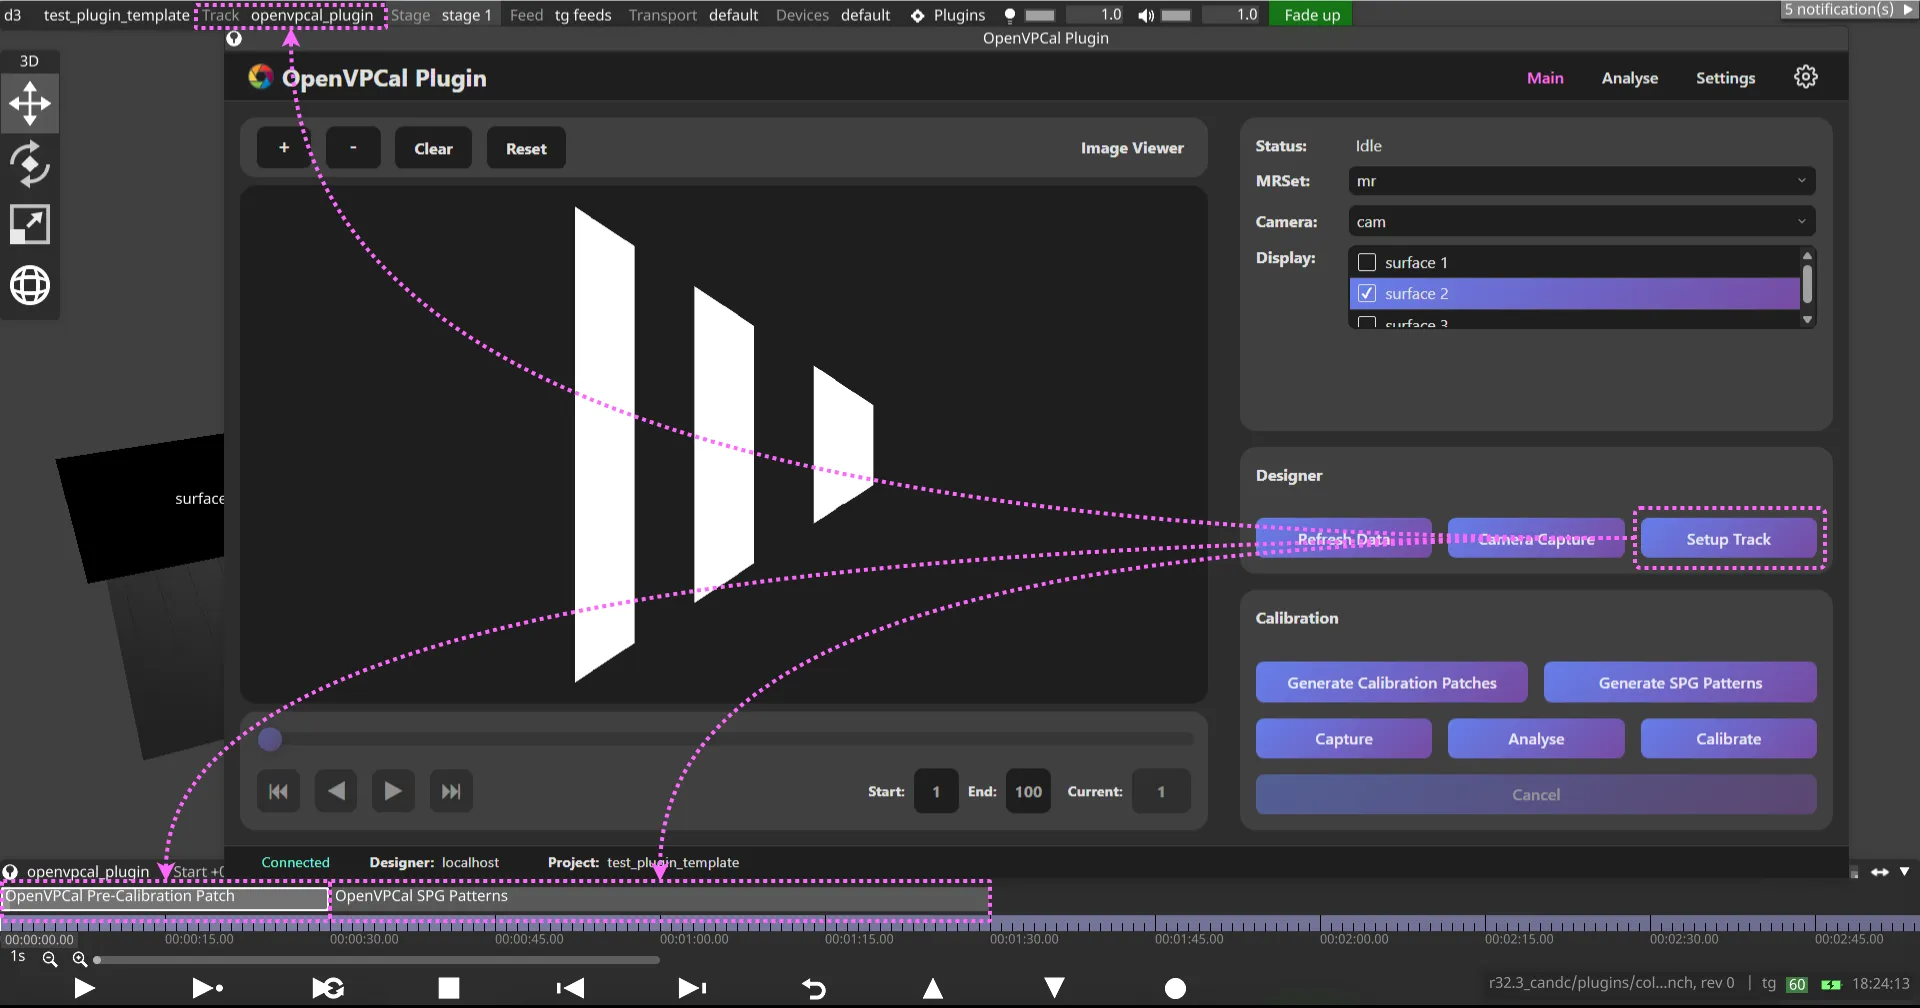
これらのレイヤーは、生成された OpenVPCal 画像のプレースホルダーとして機能します。プラグインで選択ディスプレイを変更すると、ビデオコンテンツと Mapping で割り当てられたディスプレイが自動的に更新されます。たとえば LED A を選択すると:
- OpenVPCal Pre-Calibration Patch に LED A のキャリブレーションパッチが割り当てられます。
- OpenVPCal SPG Patterns に LED A の SPG パターンが割り当てられます。
- openvpcalplugin (Direct) マッピングで LED A がディスプレイとして選択されます。
4. Calibration Control Area(キャリブレーション制御領域)
Section titled “4. Calibration Control Area(キャリブレーション制御領域)”Generate Calibration Patches
Section titled “Generate Calibration Patches”Generate Calibration Patches は次を行います。
- State area でチェックされたディスプレイのキャリブレーションに使用するキャリブレーションパッチを生成します。
- キャリブレーションパッチを Designer にアップロードします。
- Designer の現在の OCIO 設定をダウンロードします。
- ダウンロードした設定をもとに
pre_calibration_openvpcal_<config>.ocioを作成します。 - 作成した OCIO 設定をアップロードします。
- Designer の OCIO 設定を事前キャリブレーション OCIO 設定に更新します。
- LED ディスプレイのカラースペースを事前キャリブレーションカラースペースに更新します。
Settings タブで、すべての LED ディスプレイの OpenVPCal 設定を作成・構成しておいてください。
キャリブレーションに使用するキャリブレーションパッチを生成し、それを Designer にアップロードします。キャリブレーションパッチを生成する前に、Settings タブで OpenVPCal 設定を更新しておいてください。生成されたキャリブレーションパッチは次の場所に保存されます。
objects/videofile/<camera_display>/colour_patches
OpenVPCal Plugin が生成した OCIO 設定は Generate Calibration Patches に使用しないでください。使用すると、目的のカラースペースで OCIO 設定を作成できないことがあります。
ディスプレイやカメラのカラースペースを変更したい場合は、Generate Calibration Patches の処理が完了した後に更新できます。Analyse も Calibrate も OCIO 関連の設定を上書きしません。ただし、準備された OCIO 設定をそのまま使用することをおすすめします。
Generate SPG Patterns
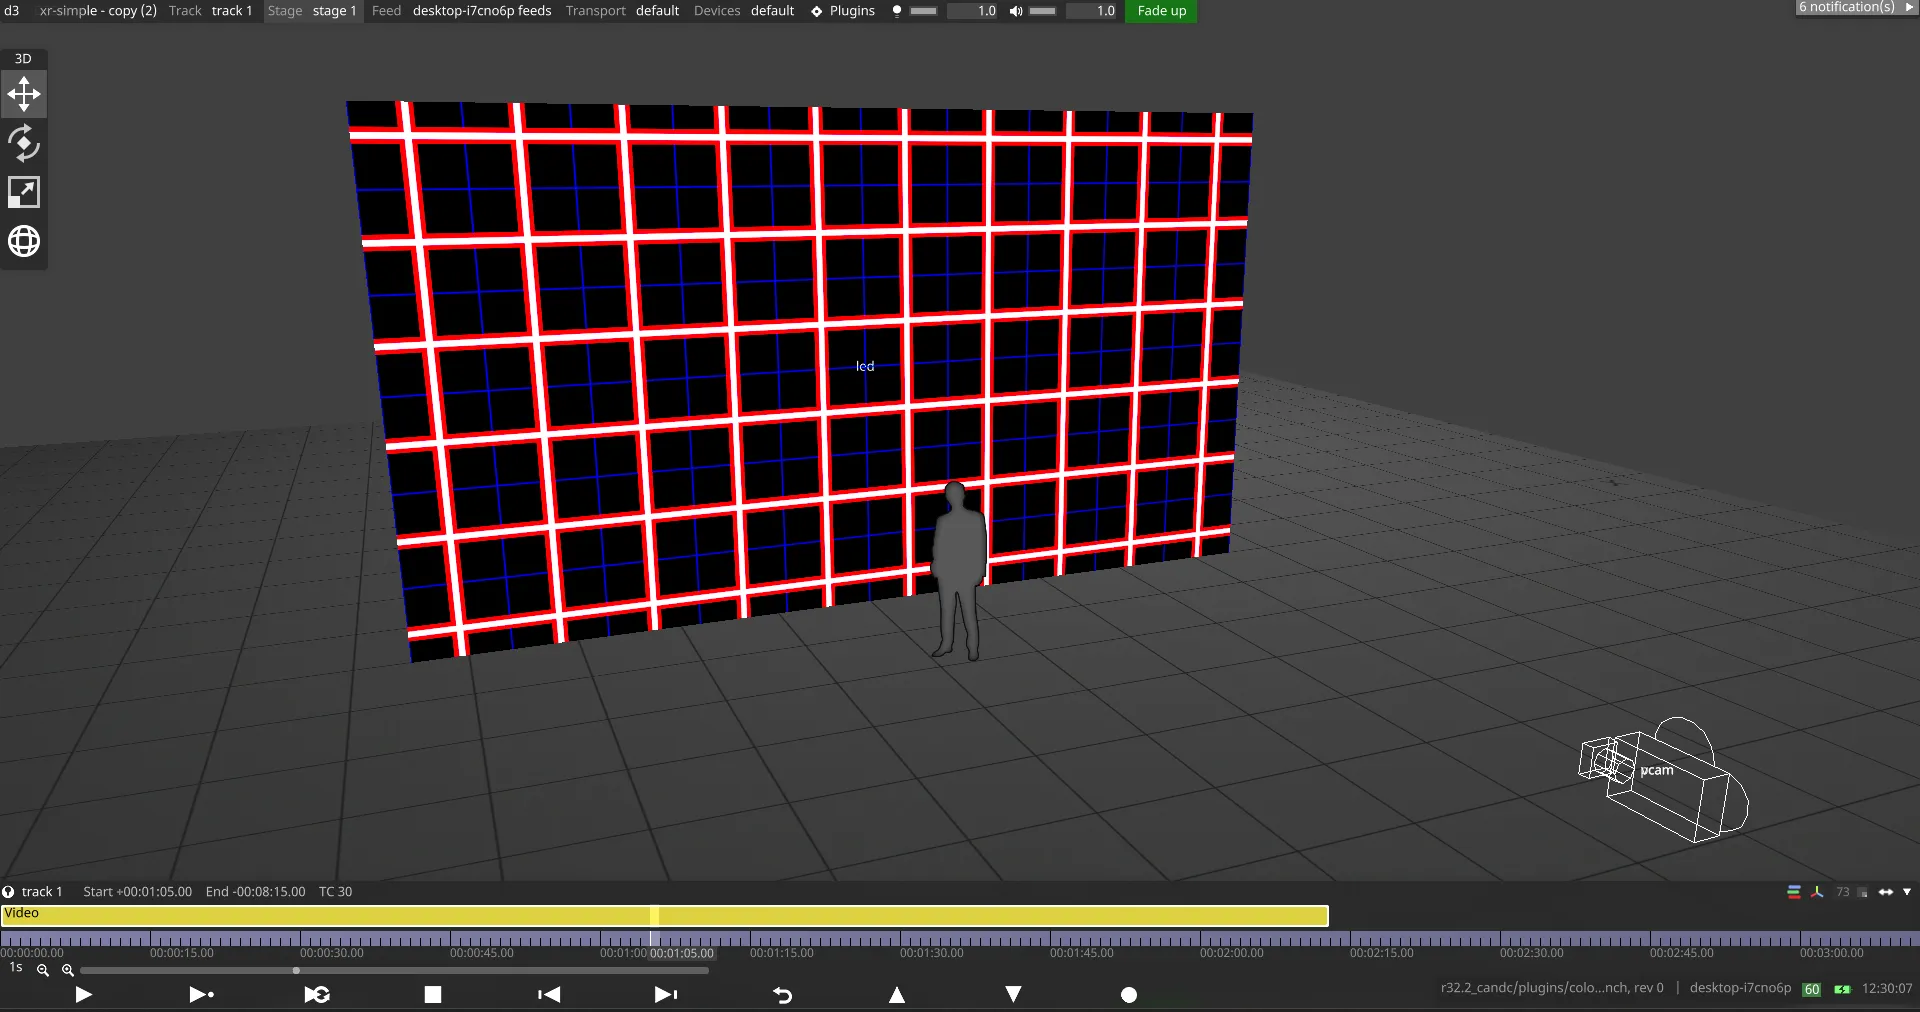
Section titled “Generate SPG Patterns”SPG(Synthetic Pattern Generator)パターンを生成すると、カラーキャリブレーションを実行する前に LED ウォールのセットアップを検証するために設計された、包括的な合成テストパターンのセットが作成されます。これらの診断パターンは、キャリブレーション精度に影響を与える可能性のあるイメージングパイプラインの潜在的な問題を特定するのに役立ちます。キャリブレーション処理に時間を投じる前に、LED ウォールとイメージングパイプラインが適切に構成されていることを確認するために不可欠です。
SPG パターンを使用するタイミング:
- セットアップを検証するため、キャリブレーションパッチの撮影前。
- 同期、マッピング、カラーパイプラインの問題を診断するため。
- LED ウォールの表示の問題をトラブルシューティングするとき。
- 構成変更後にイメージングチェーンを検証するため。
SPG パターンの使い方:
- プラグインの Main Tab に移動して Generate SPG Patterns をクリックします。生成が完了すると、パターンは
objects/videofile/<camera_display>/spg_patternsに保存されます。 - Designer でビデオレイヤーを作成します。
- ビデオレイヤーが、デバッグしたいディスプレイに直接マッピングされていることを確認します。
Video Layer > Mediaで、表示したい SPG パターンを選択します。- Frame Sync Count などの一部の SPG パターンは
.seqフレームシーケンスとして利用でき、ディスプレイに直接マッピングして通常のビデオのように再生できます。
SPG ジェネレーターは、LED ウォールのターゲット設定と同じカラースペースおよび EOTF でテストパターンを作成します。各パターンは LED ウォールとイメージングパイプラインの特定の側面をテストします。
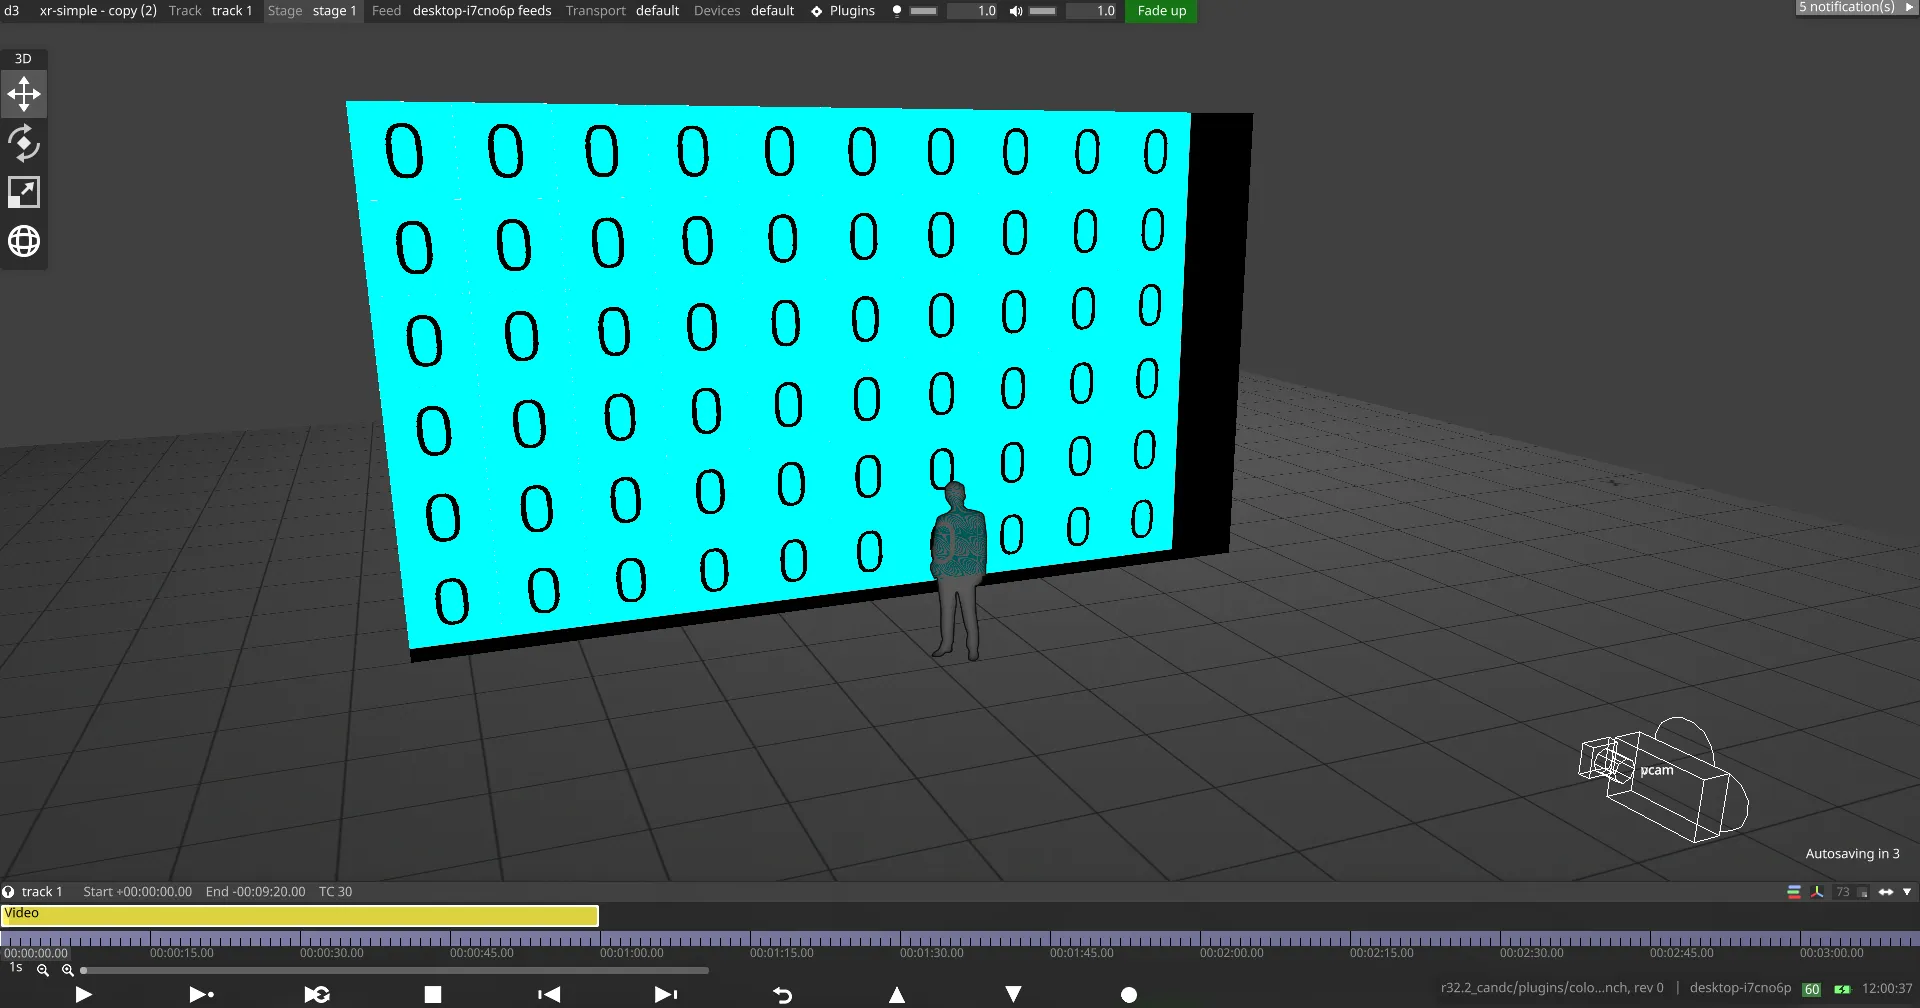
Frame Sync Count
Section titled “Frame Sync Count”連続したフレーム番号を表示して、カメラの録画フレームレートと LED ウォールの再生の間の適切な同期を検証します。ゴースト、ブレンディング、欠落した番号は、キャリブレーション前に解決すべき同期の問題を示します。パターンの正しい再生とキャプチャーを可能にするため、次を確認してください。
Video Layer > Media > Video > Editに移動- シングルフレームパターンの場合、再生フレームレート(
FPS)をカメラ録画 FPS の 1/10 に設定します。
- シングルフレームパターンの場合、再生フレームレート(
Video Layer > Media > Video > Filteringに移動- フレームブレンディングを無効にし(
Frame Blending > Off)、シーケンスが最後のフレームで停止するようにします。
- フレームブレンディングを無効にし(
カラーパッチのキャプチャーは、プラグインからキャプチャー処理を起動すると Designer が自動的に処理するため、フレーム同期の検証は冗長であることに注意してください。
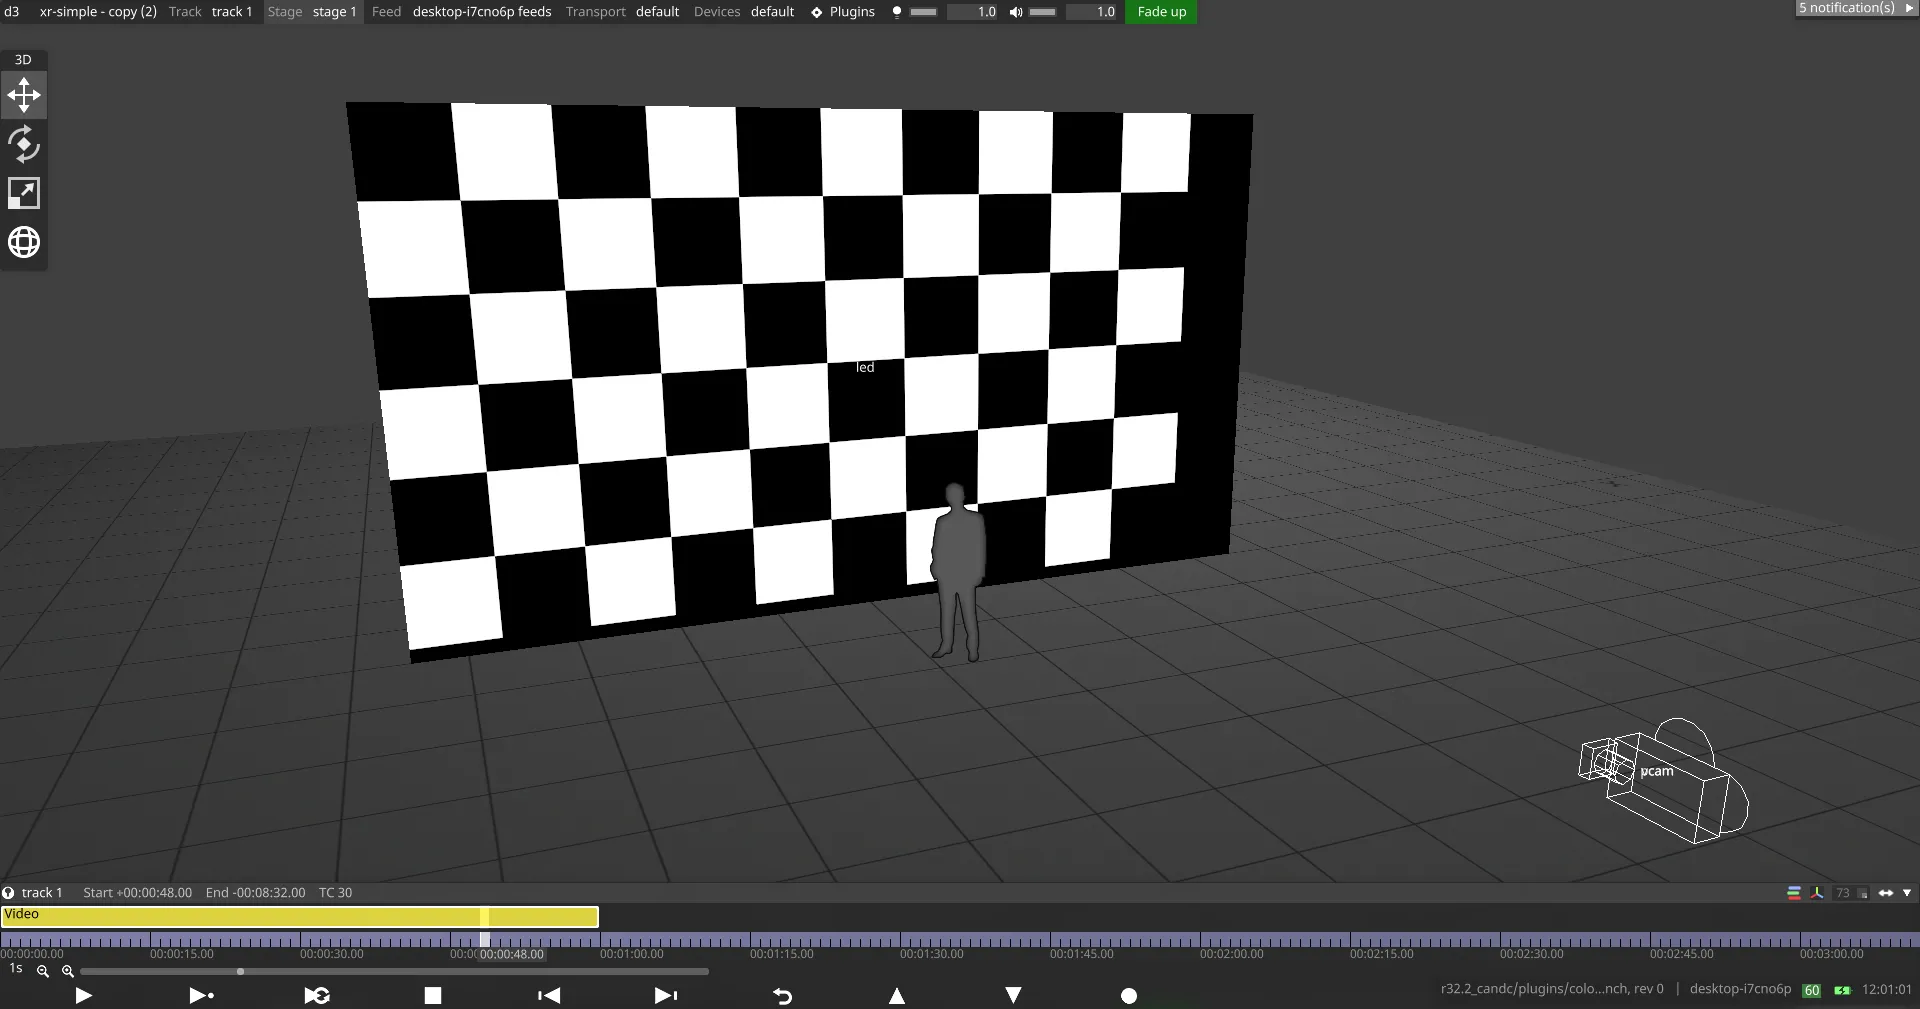
Checkerboard Patterns
Section titled “Checkerboard Patterns”複数のチェッカーボードサイズで、スケーリング、アスペクト比、マッピングの問題をテストします。LED ウォールの解像度と 1:1 で表示したとき、四角は歪みなく適切に整列して見えるはずです。
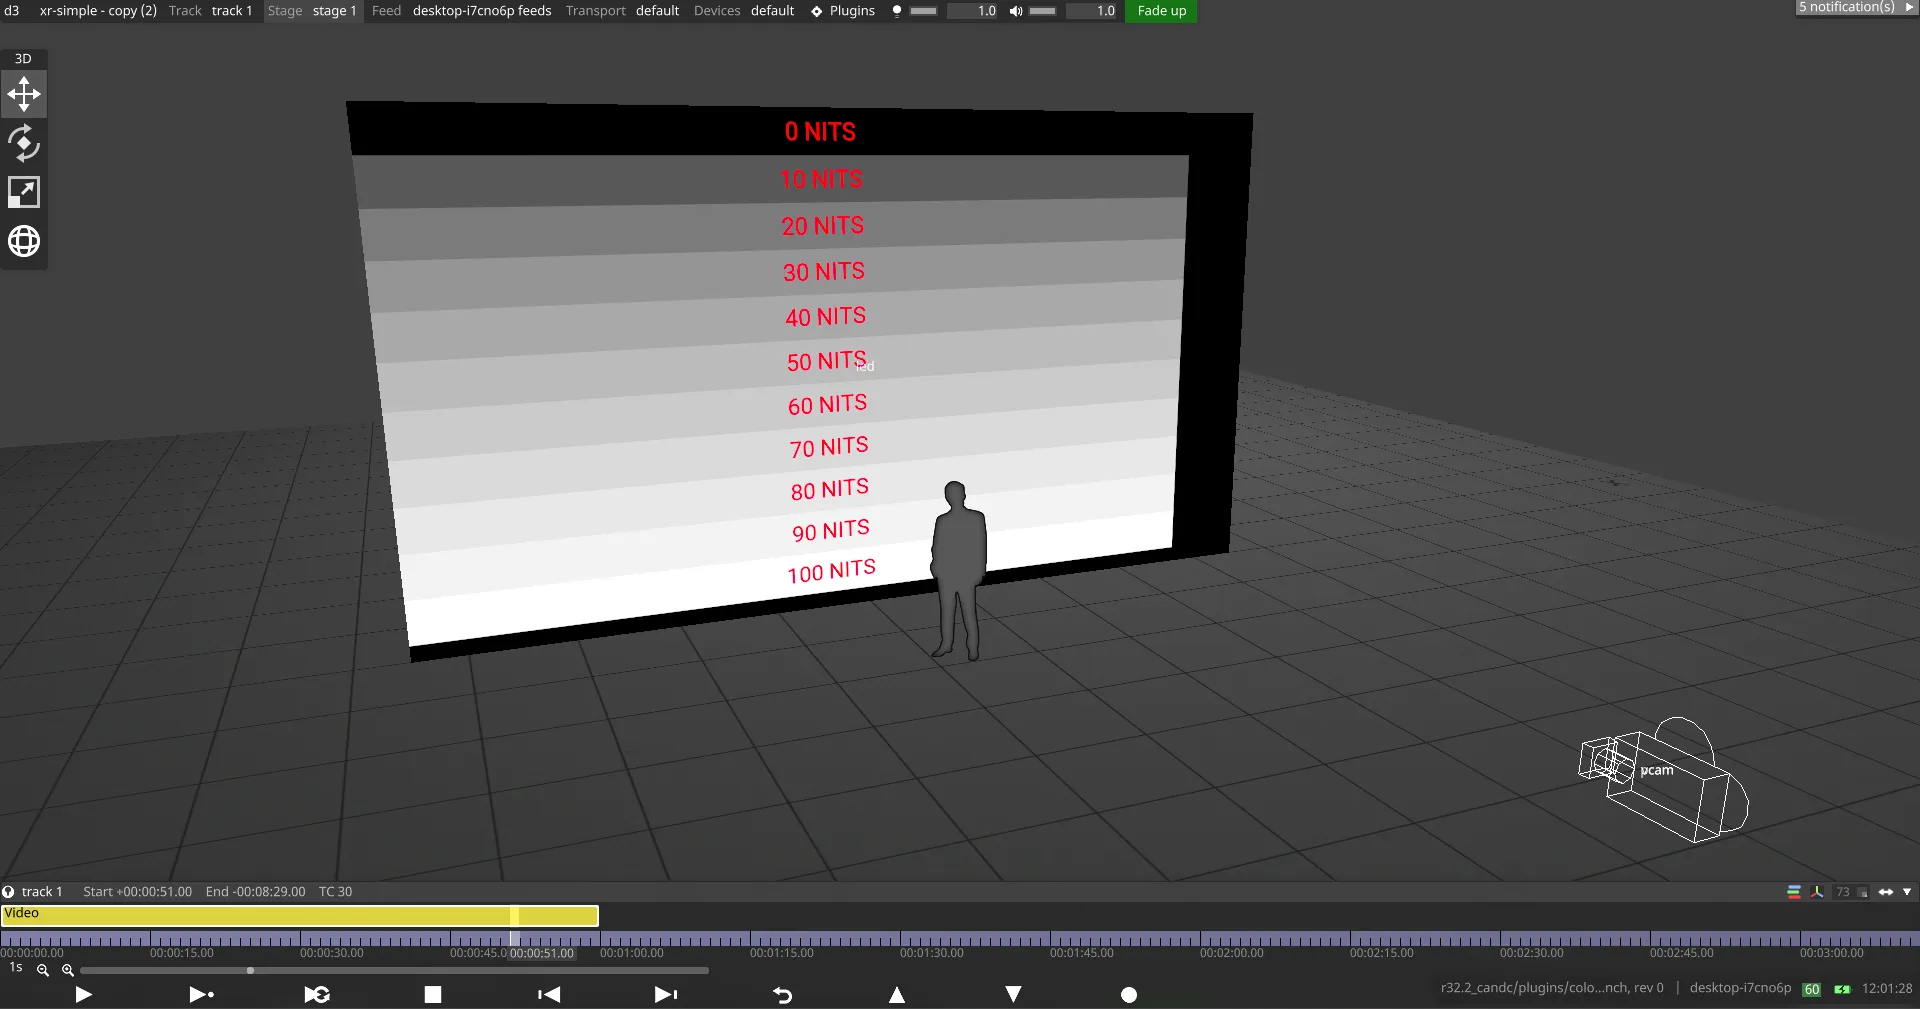
Linear Steps
Section titled “Linear Steps”PQ(ST2084)ワークフロー向けの絶対輝度ステップ(nit 単位)。ウォールのピーク輝度まで明確に区別できるバンドが見え、その限界を超えると見えるバンドがないはずです。これらのパターンは、パイプライン全体で正しい輝度マッピングを検証するのに役立ちます。正確な値は照度計でさらに検証できます。ピーク輝度値が、プラグインの OpenVPCal Settings 内の Target Max Lum フィールドに反映されていることを確認してください。
Exposure Stops
Section titled “Exposure Stops”カメラのフォルスカラー表示を通して見たときに、カメラの露出設定を 1 ストップ刻みで調整することで、線形の照明応答を検証できるテストパターン。
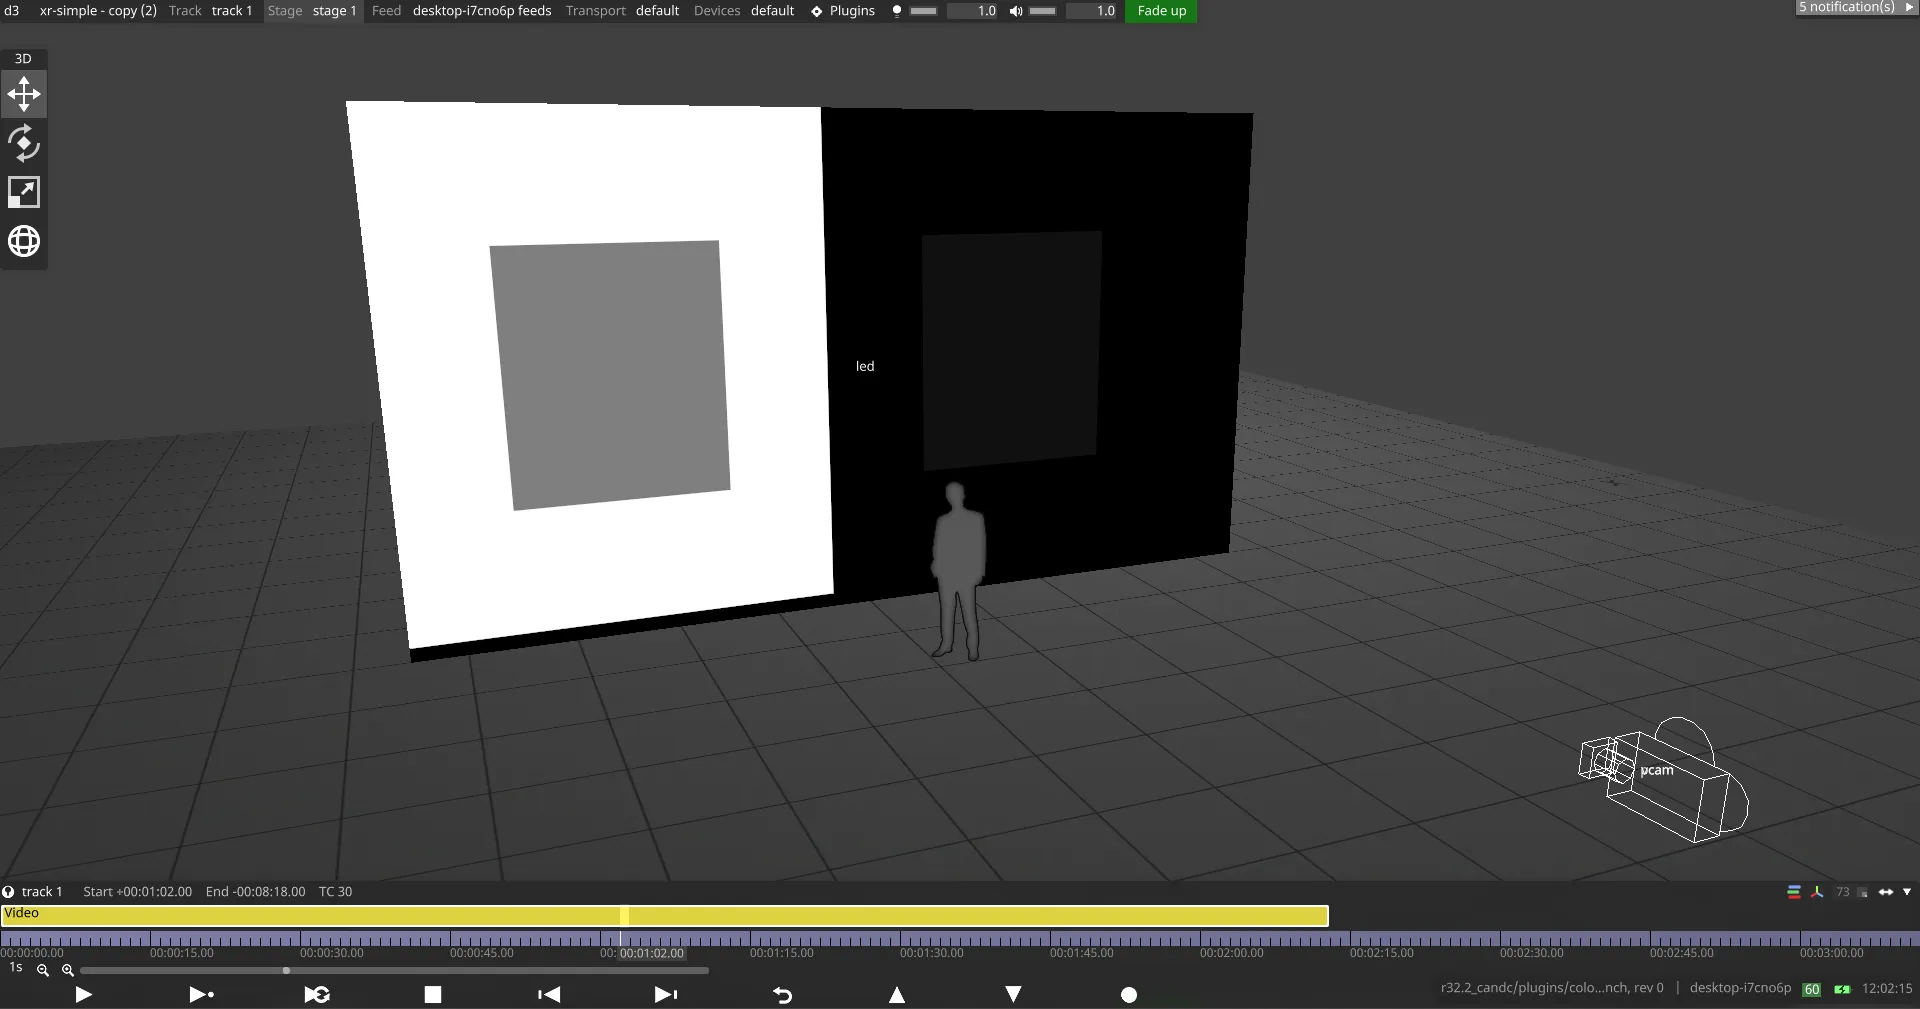
Data Range Verification
Section titled “Data Range Verification”イメージングチェーンが legal レンジではなく extended(full)レンジで動作することを確認します。正しく構成されている場合、テストパッチ内の内側の四角が明確に区別できるはずです。
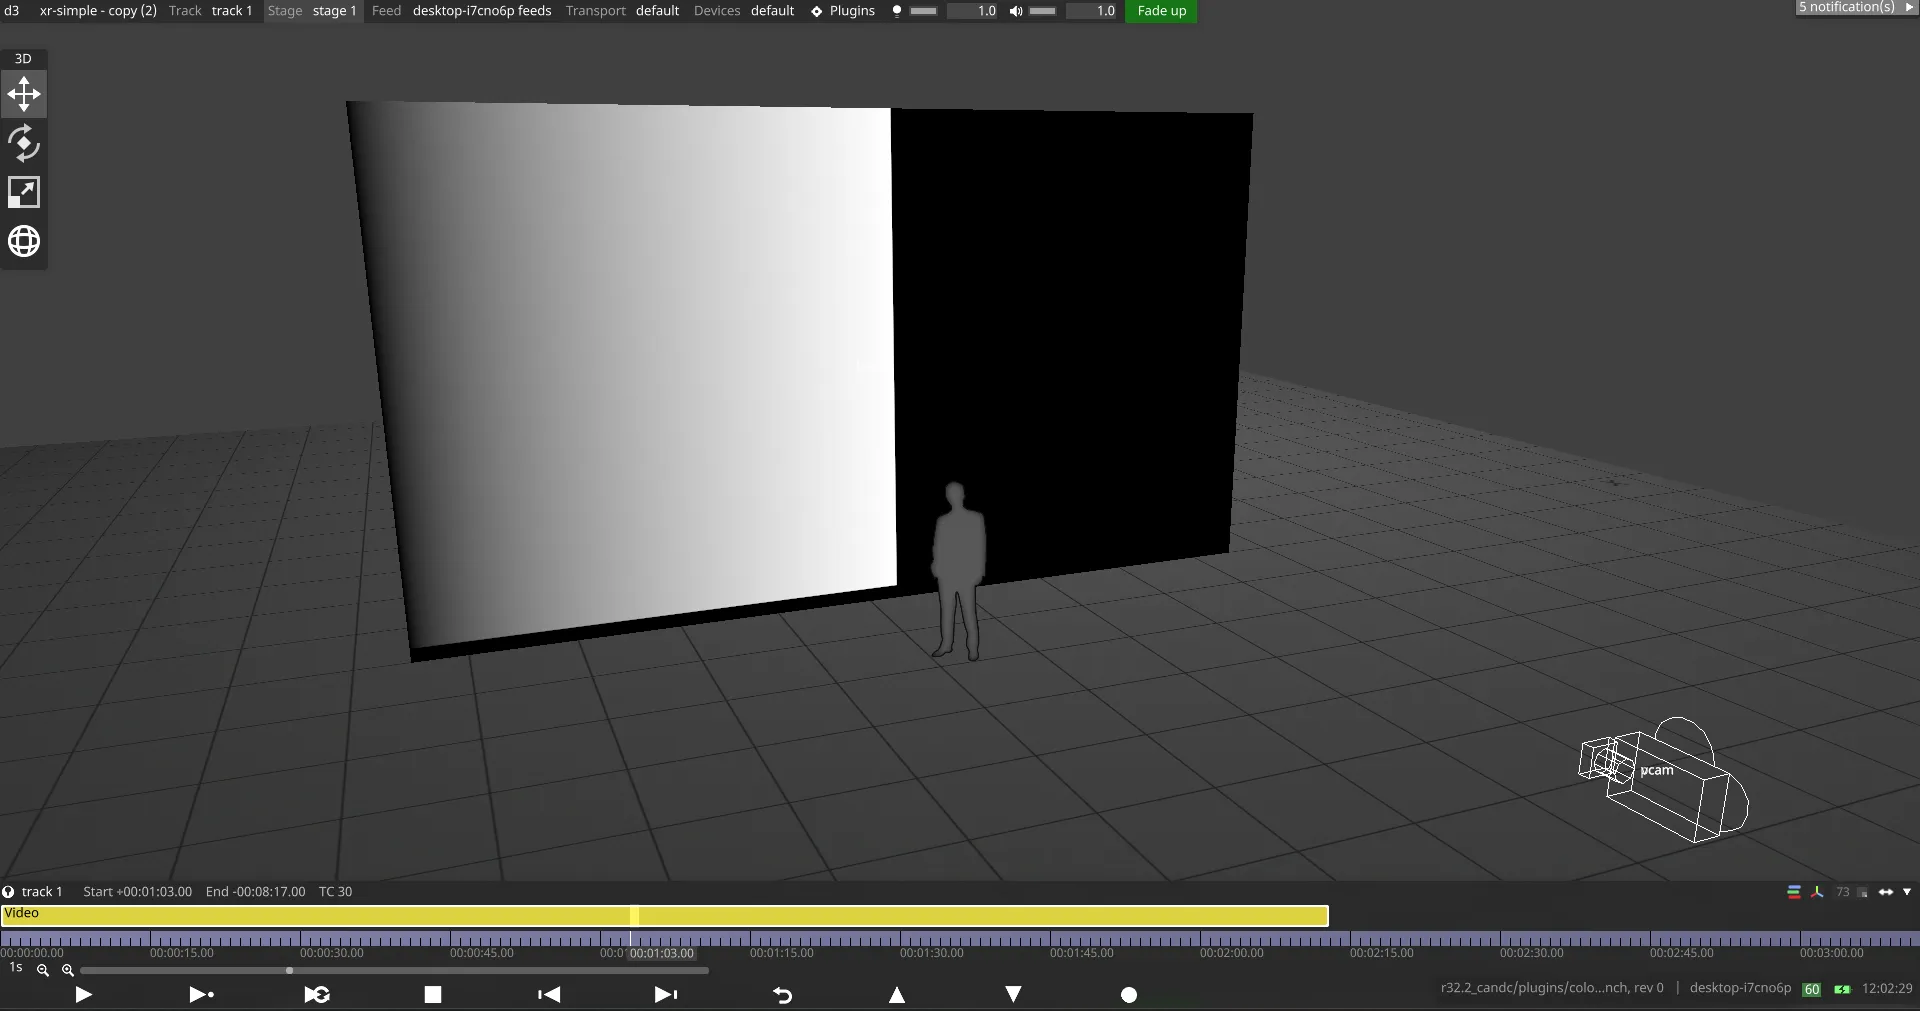
Bit Depth Testing
Section titled “Bit Depth Testing”グレーランプパターンは、イメージングチェーンが 10 ビット処理を維持しているかどうかを明らかにします。縦方向のバンディングが見える場合は、キャリブレーション品質に影響を与える可能性のある 8 ビットの制限を示します。
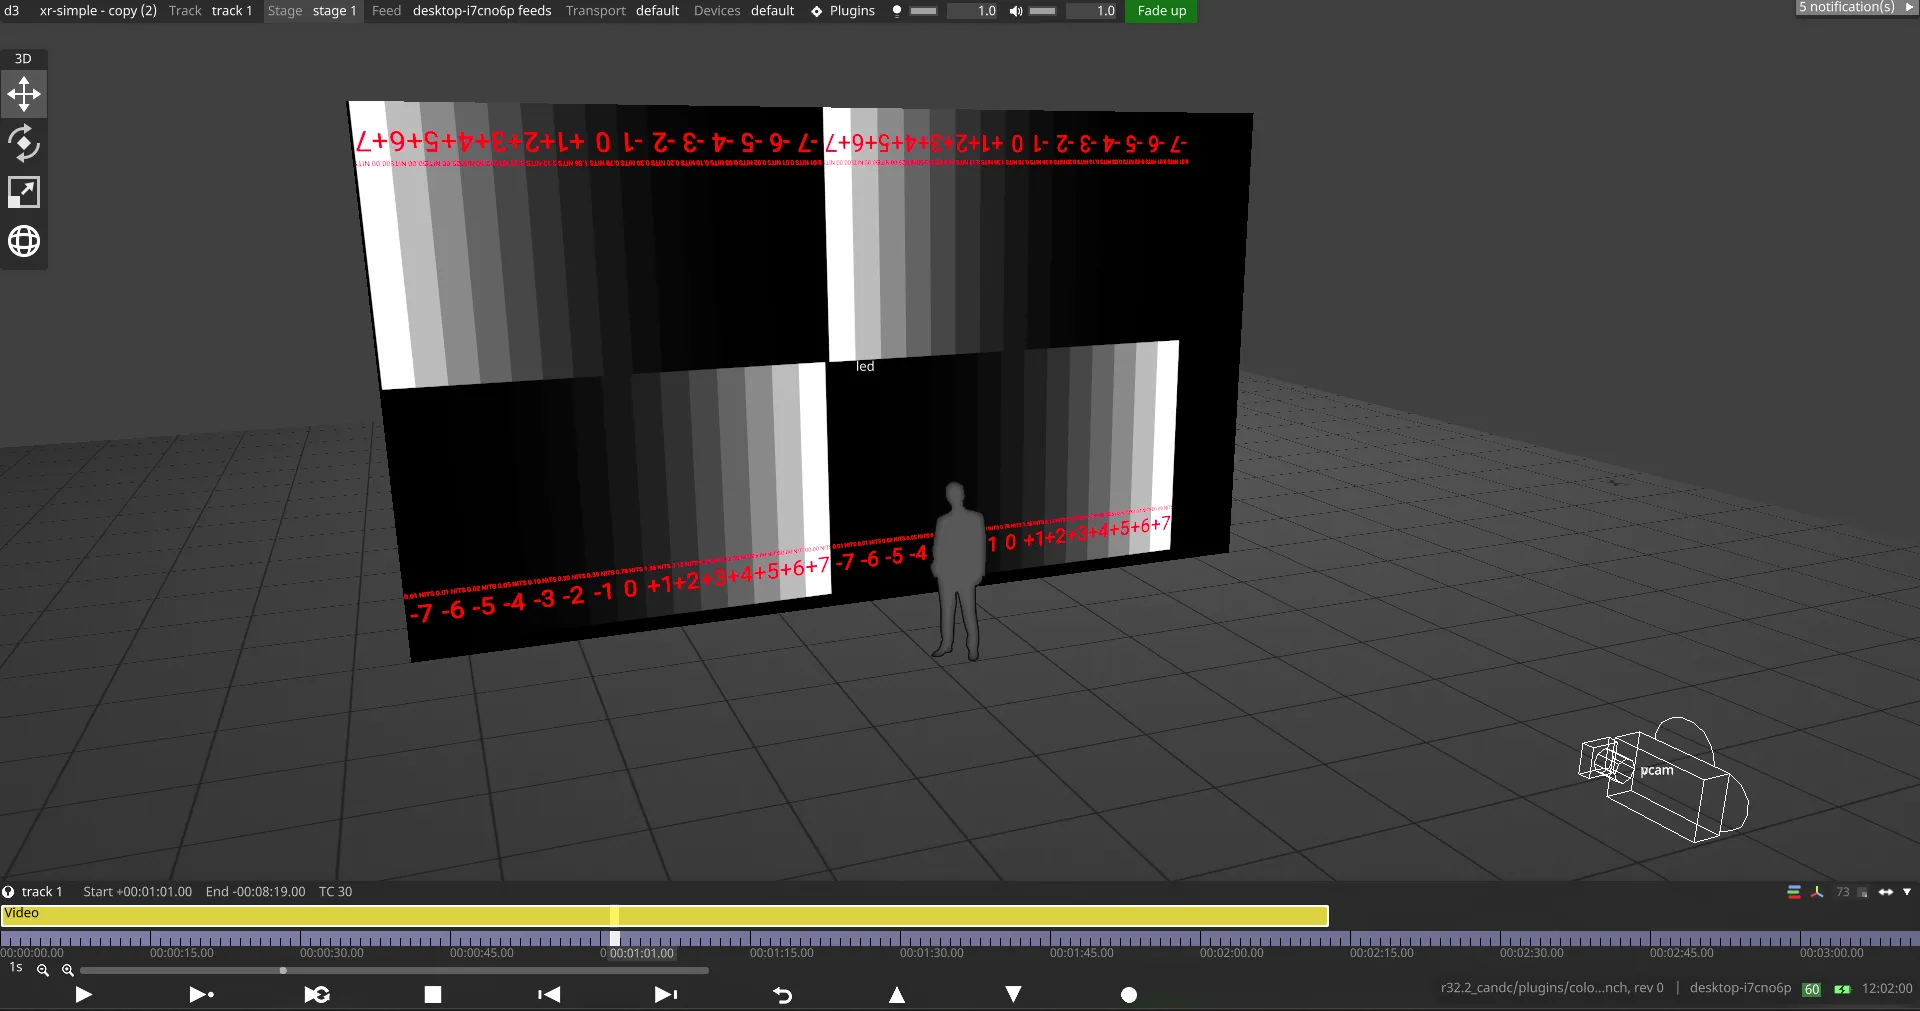
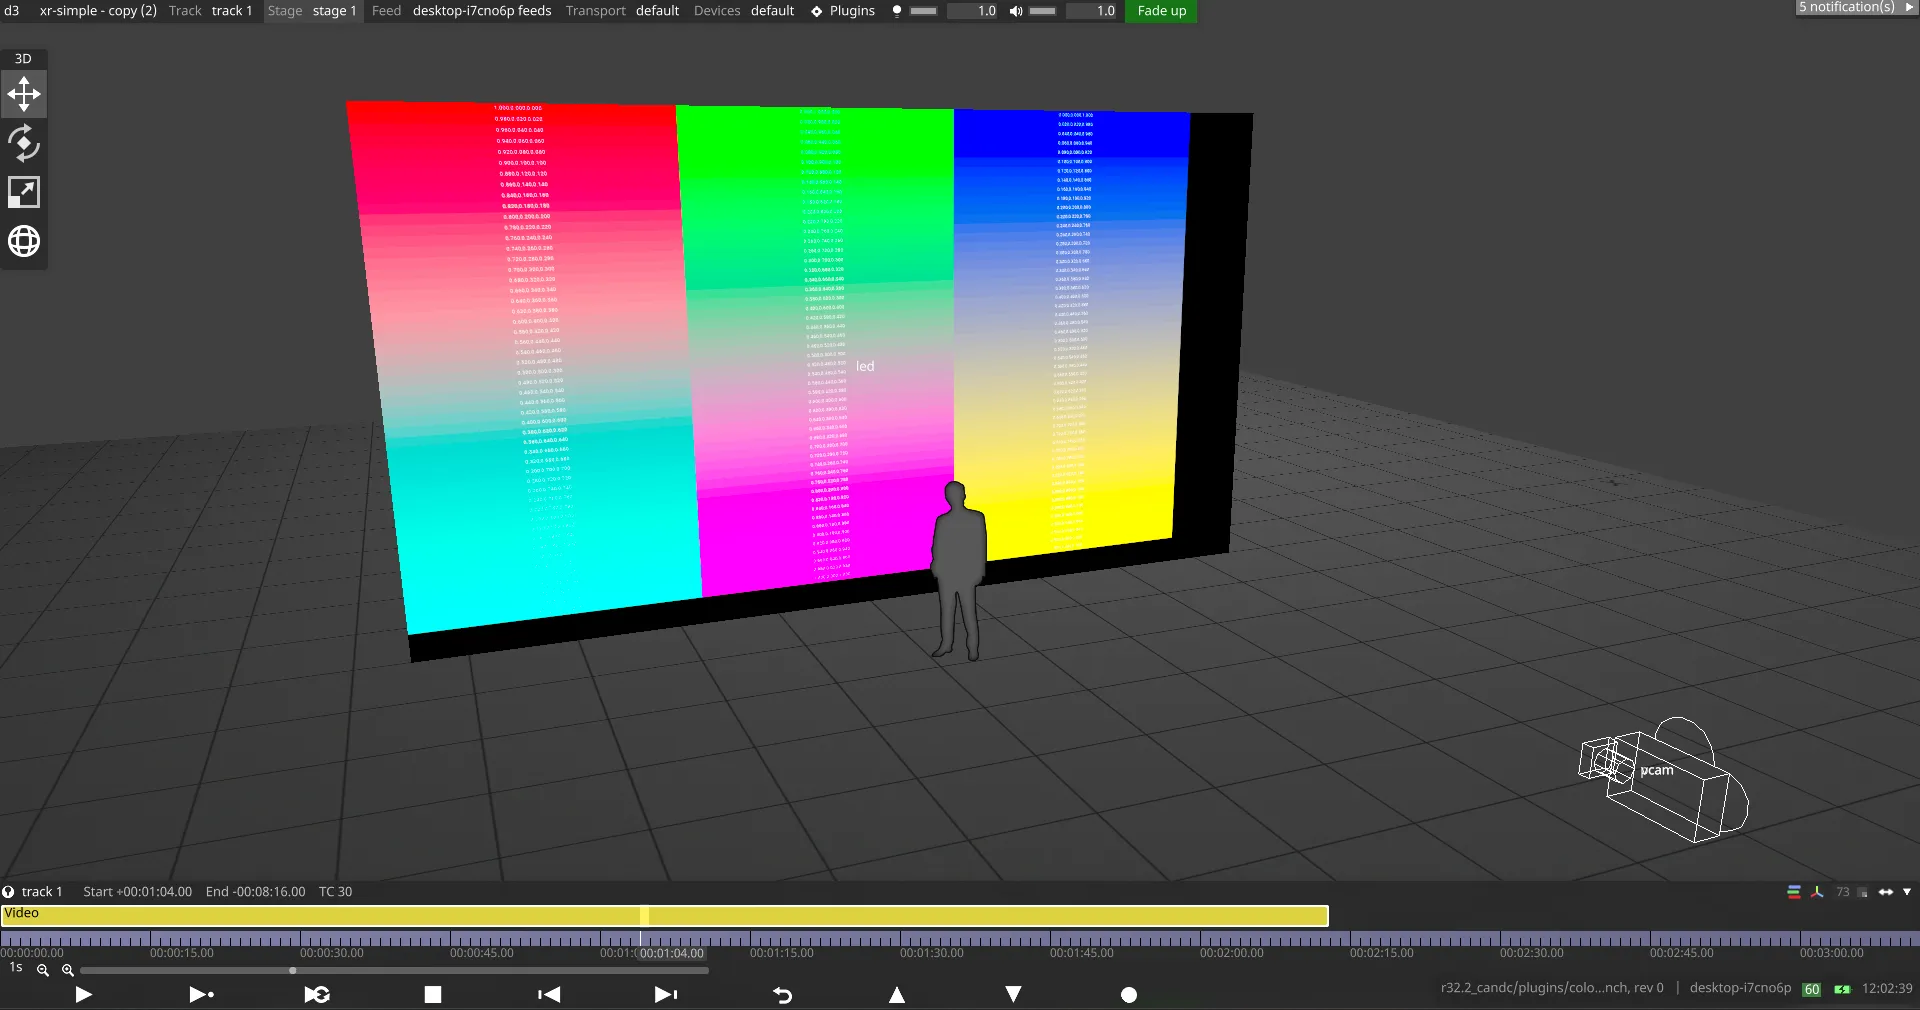
Colour Steps
Section titled “Colour Steps”グラデーションカラーパターンは、カラークリッピングをテストし、パイプライン全体で適切なカラースペース処理が行われているかを検証します。黒いバンドや区別できないステップのない滑らかなグラデーションは、正しい構成を示します。
Real Black Level
Section titled “Real Black Level”多重化アーティファクトがカメラで見えるようになる前の、LED パネルの真の黒の能力を判定します。これは、キャリブレーションの実用的な黒レベルの限界を確立するのに役立ちます。
Alignment Grids
Section titled “Alignment Grids”クロスパターンとグリッドは、物理的な構造の整列とコンテンツマッピングの精度を検証します。整列していないパターンは、ハードウェアまたはマッピング構成の問題を示します。
SPG パターンテストのベストプラクティス
Section titled “SPG パターンテストのベストプラクティス”- 本番のカメラセットアップを通してパターンを表示します。
- マルチプロセッサー LED ウォールのすべてのセクションで一貫性を確認します。
- キャリブレーションパッチ生成に進む前に、特定された問題を解決します。
Capture
Section titled “Capture”Capture ボタンは、State area で選択されたディスプレイに対して Designer の画像シーケンスキャプチャー処理をトリガーします。キャプチャー処理は順次行われることに注意してください(つまり、ディスプレイ 1 のキャプチャーが最初に行われ、その後ディスプレイ 2 に進みます)。
- Designer の OCIO 設定を事前キャリブレーション OCIO 設定
pre_calibration_openvpcal_<config>.ocioに更新します。- Update OCIO Config on Capture が無効な場合はスキップされます。
- 各ディスプレイの画像シーケンスキャプチャーを開始します。
- キャプチャーしたすべての画像を Designer からダウンロードします。ダウンロードされた画像は次の場所に保存されます。
Documents/d3plugins/openvpcal/assets/<project>/<camera__display>/capture
- ダウンロードしたすべての EXR(ACES2065-1)画像を、プレビュー用に PNG(sRGB)に変換します。次の場所に保存されます。
Documents/d3plugins/colourcal/assets/<project>/<camera__display>/preview
- すべてのプレビュー画像をフロントエンドに読み込みます。
Analyse
Section titled “Analyse”Analyse ボタンは、キャプチャーした画像を使って分析処理を開始し、分析結果データを生成します。この処理は Designer とやり取りしません。代わりに、プラグインはダウンロードしたキャプチャー画像を使って分析を実行します。分析結果は Analyse タブ から確認できます。
Main Canvas でキャリブレーションを実行する ROI を設定すると、分析処理を高速化できます。ROI が設定されていない場合、検出アルゴリズムがキャリブレーションを実行する ROI を探し、その後分析処理を開始します。検出された ROI はメインキャンバスに表示されます。
分析が完了すると、Calibration Result にフィードバックが提供されます。すべての分析データは Analyse タブ にも提供されます。
Calibrate
Section titled “Calibrate”分析結果に満足したら、キャリブレーションを実行できます。キャリブレーション処理は次を行います。
- キャリブレーション結果の Output Transform を含む新しい OCIO config
post_calibration_openvpcal_<hash>.ocioを作成します。 - 新しく作成した OCIO config を Designer にアップロードします。
- Designer の OCIO config を
post_calibration_openvpcal_<hash>.ocioに設定します。 - LED ディスプレイの Output transform を補正済みの Output transform に設定します。
Cancel
Section titled “Cancel”Generate Calibration Patches、Generate SPG Patterns、Capture、Analyse、Calibrate をキャンセルできます。処理が競合状態の可能性があるファイル I/O タスクを実行している場合、キャンセルボタンは無効になることに注意してください。
Updated Fields
Section titled “Updated Fields”この表は、Main タブで各ボタン操作を実行したときに変更されるフィールドと設定をまとめたものです。
| Action | プラグインで更新されるデータ | Designer で更新されるデータ |
|---|---|---|
| Generate SPG Patterns |
|
|
| Generate Calibration Patches |
|
|
| Capture |
|
|
| Analyse |
| |
| Calibrate |
|
|
フィールドの定義:
- Base OCIO config: 事前キャリブレーションと事後キャリブレーションの設定の派生元となるベースライン OCIO 構成ファイル。
- OCIO config: Designer の
Project Settings > Colour Managementで選択されているアクティブな OCIO 構成。 - pre_calibration: 命名パターン
pre_calibration_openvpcal_<hash>.ocioで生成される構成ファイル。パターン生成とキャプチャー時に適用され、ディスプレイをキャリブレーションに備えます。 - post_calibration: 命名パターン
post_calibration_openvpcal_<hash>.ocioで生成される構成ファイル。キャリブレーション成功後に適用される補正済み output transform を含みます。 - Generated SPG Patterns:
.seq形式で Designer にアップロードされる SPG パターンの VideoClip リソース。 - Camera input transform(colour patches):
objects/videofile/<camera_display>/colour_patchesにあるキャリブレーションカラーパッチ VideoClip の input transform。 - LED screen output transform(補正済み): キャリブレーション成功後に LED screen に適用される補正済みディスプレイトランスフォーム。
Analyse Tab(Analyse タブ)
Section titled “Analyse Tab(Analyse タブ)”Analyse タブは、キャリブレーション品質に関する包括的な視覚フィードバックを提供し、キャリブレーションの分析結果を表示します。このタブは、キャリブレーション前後で LED ディスプレイがターゲットのカラー仕様にどれだけ一致しているかを示します。分析結果を見るには、Main タブ から Analyse または Calibrate 処理を完了する必要があります。
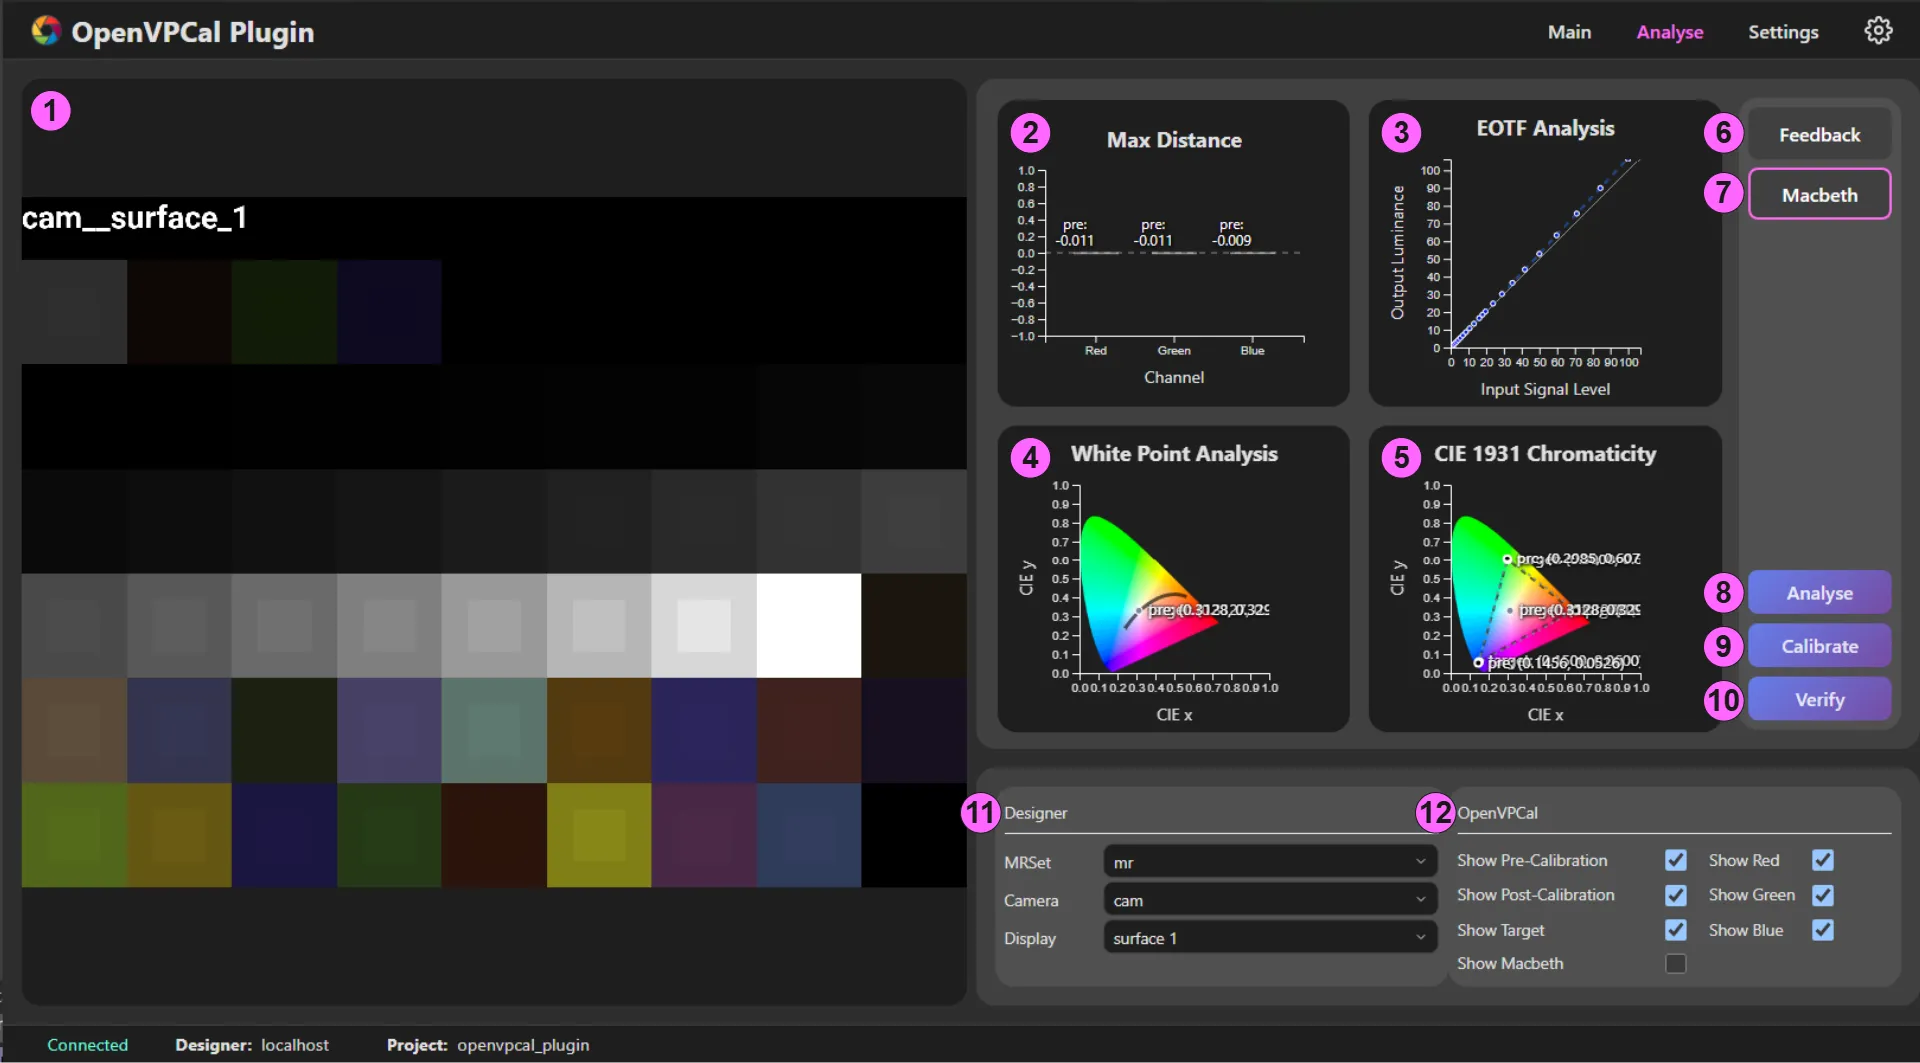
Analyse タブの要素
Section titled “Analyse タブの要素”- Analyse Main Cavas
- Max Distance Graph
- EOTF Analysis Graph
- White Point Analysis Graph
- CIE 1931 Chromaticity Diagram
- Feedback
- Macbeth Chart
- Analyse
- Calibrate
- Verify
- Designer Control
- Analysis Graph Control
Mouse Control
Section titled “Mouse Control”すべてのグラフは、次のコントロールによるインタラクティブな操作をサポートします。
- 左クリック + ドラッグ: ビューのパン/移動。
- ホイールアップ: ズームイン。
- ホイールダウン: ズームアウト。
- ホイールクリック(MMB): ズームレベルと位置を既定に戻す。
1. Analyse Main Canvas
Section titled “1. Analyse Main Canvas”メインキャンバスは、現在選択されているグラフを詳細な検査のために表示します。
- グリッドからサムネイル(項目 2〜6)をクリックして選択したグラフを表示します。
- 詳細な検査のためのズームとパンの機能を提供します。
2. Max Distance Graph
Section titled “2. Max Distance Graph”この棒グラフは、各 RGB チャンネルの最大カラー誤差を表示し、全体的なカラー精度を素早く評価できます。
表示内容:
- Red、Green、Blue のバー: ターゲットとキャプチャー画像の間の各カラーチャンネルの最大距離。
- キャリブレーション前のバー: キャリブレーション前の誤差を示す太いバー。
- キャリブレーション後のバー: キャリブレーション後の誤差を示す細いバー。
- 数値: ターゲットとキャプチャー画像の間の各カラーチャンネルの誤差。
結果の解釈:
- 短いバー = 高精度: ゼロに近い値は優れたキャリブレーションを示します。
- 高さの比較: キャリブレーション後のバーは、キャリブレーション前のバーより短くなるはずです。
- 大きな残留誤差: LED ハードウェアの制限や、調査が必要なキャリブレーションの問題を示すことがあります。
- 負の距離: キャプチャー画像が意図より暗い。
- 正の距離: キャプチャー画像が意図より明るい。
3. EOTF Analysis Graph
Section titled “3. EOTF Analysis Graph”このグラフは Electro-Optical Transfer Function(EOTF)を表示し、入力信号レベルが出力輝度にどう変換されるかを示します。これにより、ディスプレイが輝度範囲全体で明るさを正しく再現しているかが分かります。
表示内容:
- 白い対角参照線: 完全な線形応答(入力 = 出力)を表します。
- キャリブレーション前の線: キャリブレーション前の各 RGB チャンネルの輝度応答を示す破線。
- キャリブレーション後の線: キャリブレーション後の補正された輝度応答を示す実線。
結果の解釈:
- 対角線に近い線 = 正確: 偏差が小さいほど適切な輝度再現を意味します。
- 曲線: ガンマやトーンカーブの問題を示します。
- キャリブレーション後の改善: 実線は破線よりも参照対角線に近づくはずです。
- 滑らかな曲線: バンディングやクリッピングのない良好なトーン応答を示します。
- 対角線より上の曲線: ディスプレイが意図より明るい。
- 対角線より下の曲線: ディスプレイが意図より暗い。
- 滑らかでない曲線: ビット深度や処理の問題を示すことがあります。
4. White Point Analysis Graph
Section titled “4. White Point Analysis Graph”このグラフは、CIE 1931 色度図上のホワイトポイント精度を示し、色温度とティントの特性を表示します。
表示内容:
- Planckian locus(黒体軌跡): 異なる色温度での黒体放射を示す黒い曲線。
- ターゲットホワイトポイント: 参照ターゲットマーカー。
- キャリブレーション前のホワイトポイント: 初期の測定ホワイトポイントを示すマーカー。
- キャリブレーション後のホワイトポイント: 補正されたホワイトポイントを示すマーカー。
結果の解釈:
- マーカーが近い = ホワイトバランスが良好: 距離は色温度のずれを示します。
- キャリブレーション後がターゲット付近: ホワイトポイント補正の成功を示します。
- ターゲットからの距離: カラーキャスト(緑/マゼンタ、または青/黄のずれ)の大きさを示します。
- 一般的なターゲット: ICVFX ワークフローの LED ウォールでは D65(6500K)。
- キャリブレーション後の大きな分離は、カメラのホワイトバランスの問題を示すことがあります。
5. CIE 1931 Chromaticity Diagram
Section titled “5. CIE 1931 Chromaticity Diagram”このグラフは、標準的な CIE 1931 カラースペース上のカラーガモットを表示し、ディスプレイが再現できる色の範囲を示します。
表示内容:
- カラー三角形: 達成可能なカラーガモットを形成するように接続された RGB プライマリ。
- ターゲットガモット: 目的のターゲットガモットを示す破線。
- キャリブレーション前のガモット: 初期のディスプレイの能力。
- キャリブレーション後のガモット: 補正されたディスプレイの能力。
- ホワイトポイント: 三角形内のニュートラルカラーの位置を示す円。
- Macbeth サンプル(任意): 測定された ColourChecker パッチの位置を示す色付きのドット。
結果の解釈:
- 大きい三角形 = 広いガモット: ディスプレイが再現できる色が多い。
- 三角形の形状が重要: キャリブレーション後の三角形は、ターゲットの形状に近くなるはずです。
- 完全な一致はしばしば不可能: ハードウェアが物理的にターゲットプライマリに到達できないことがあります。
- 小さな不一致は許容: キャリブレーションはハードウェアの制約内で最適化します。
- カバレッジの確認: 三角形は、コンテンツにとって重要な色を囲むはずです。
- 三角形の頂点は RGB プライマリの色度を示します。
- 三角形の内部には再現可能なすべての色が含まれます。
- 三角形の外側の領域はガモット外の色(正確に表示できない)を表します。
6. Feedback
Section titled “6. Feedback”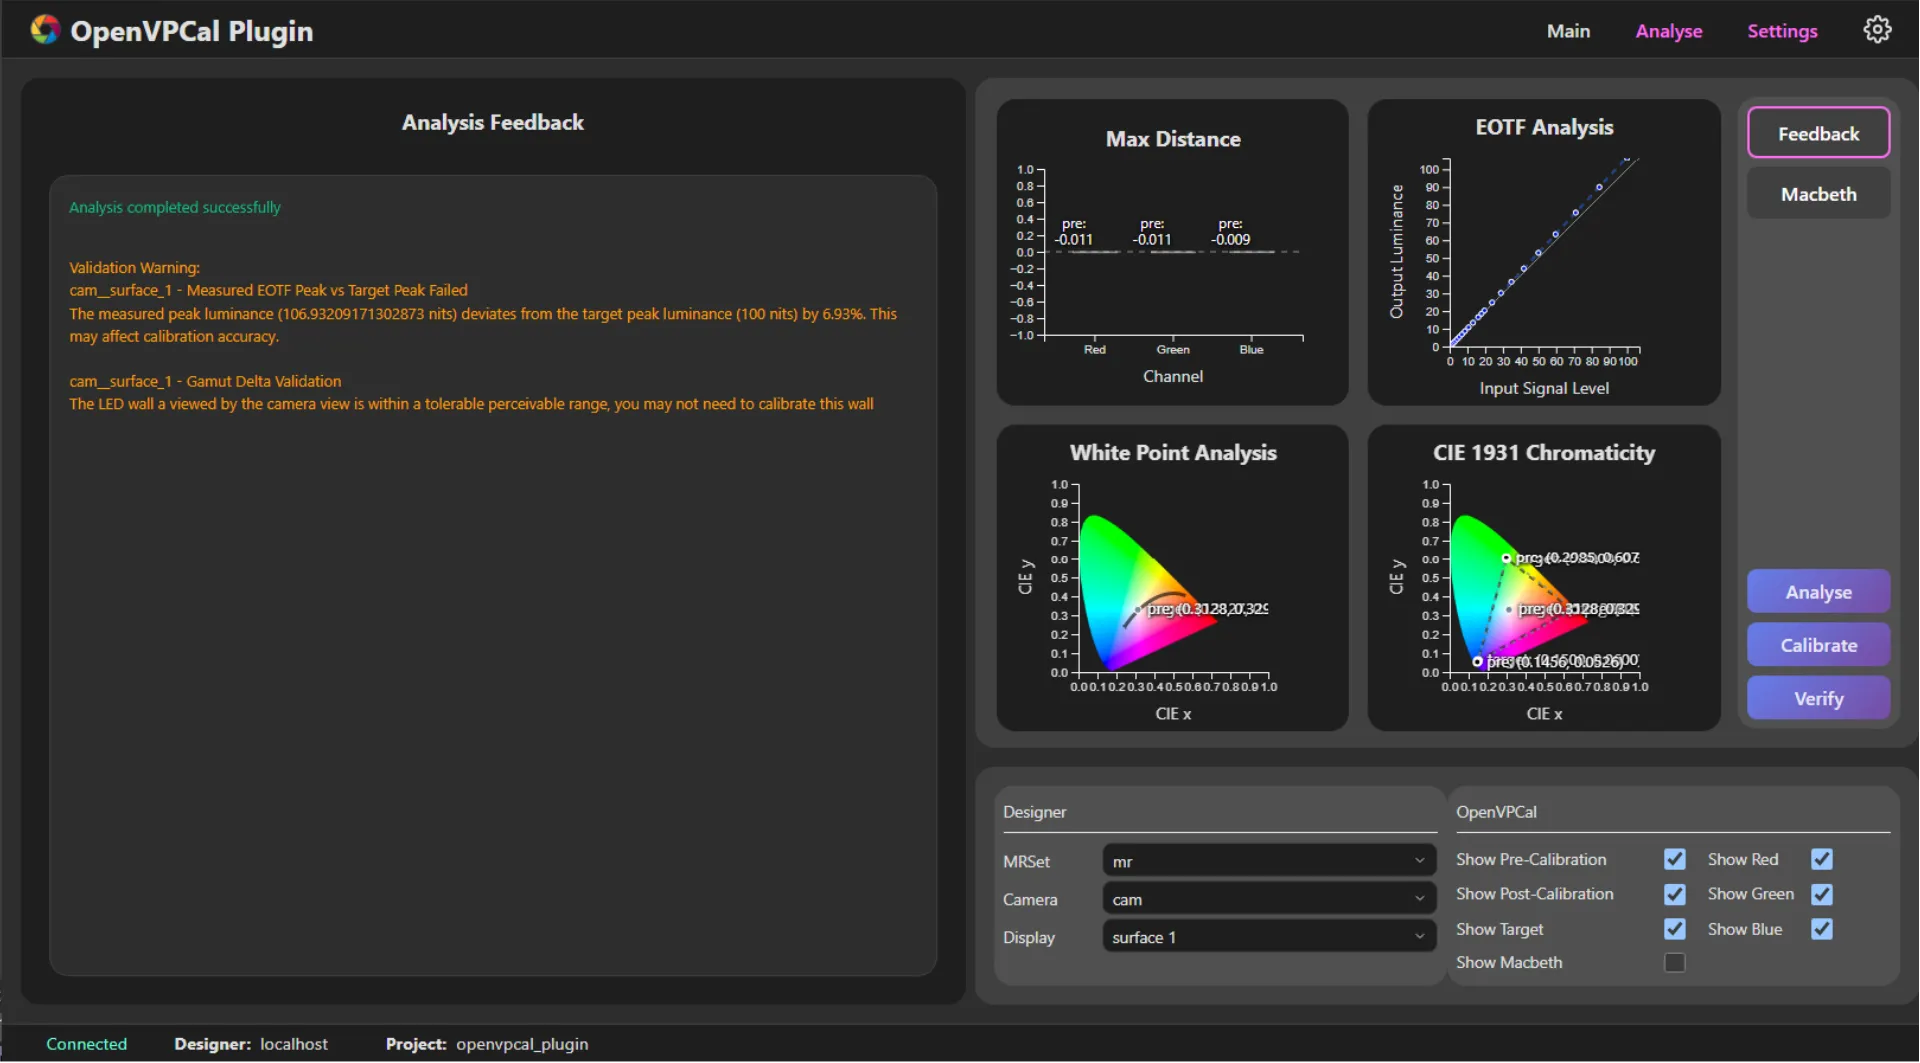
Analyse または Calibrate 処理が完了すると、このセクションに結果に関するフィードバックが表示されます。分析やキャリブレーション中に検出された問題を強調し、最良のキャリブレーション出力を得るためのガイダンスを提供します。
一般的な OpenVPCal の分析・キャリブレーションフィードバック
Section titled “一般的な OpenVPCal の分析・キャリブレーションフィードバック”-
Measured Exposure Validation
- 問題: カメラ露出が正しくありません(例: 必要な 18% ではなく 5.0% を測定)。
- 解決策: 次の手順でカメラを再露出します。
- 最初のキャリブレーションパッチ(中央のグレーの四角付き)を表示します。
- カメラのフォルスカラー表示または照度計を使用します。
- 中央のグレーの四角全体が正確に 18% を示すまでカメラ設定を調整します。
- フレーム下部の 17% と 19% の参照パッチを使って露出を微調整します。
- 補正した露出ですべてのキャリブレーションパッチを再撮影します。
-
Measured EOTF Peak vs Target Peak Failed
- 問題: 測定されたピーク輝度とターゲット輝度の間に大きな不一致があります。
- 解決策: イメージングパイプライン全体を確認します。
- SPG Linear Steps パターンを使って、パイプライン全体の輝度マッピングを検証します。
- プラグインの Target Max Lum 設定が、LED ウォールの実際のピーク能力と一致していることを確認します。
- Designer が正しい EOTF トランスフォーム(例: HDR コンテンツの ST2084)を適用していることを確認します。
- LED プロセッサー設定を確認 — ピーク輝度が正しく設定され、クランプされていないことを確認します。
- イメージングチェーンで予期しないゲインや明るさの調整が適用されていないことを確認します。
- イメージングチェーンの構成を修正した後、パッチを再撮影します。
-
EOTF Validation
- 問題: ディスプレイの明るさ応答曲線が、期待されるターゲット EOTF から逸脱しています。
- 解決策: イメージングパイプラインをトラブルシューティングします。
- プラグインの Target EOTF と LED プロセッサー構成の間で EOTF 設定が一致していることを確認します。
- Designer のカラーマネジメントを確認 — 必要な EOTF トランスフォームのみがパッチに適用されていることを確認します。
- イメージングチェーンのトーンマッピングやクリエイティブなカラーグレーディングを無効にします。
- パイプライン全体でビデオデータレンジが一貫している(Full/Extended と Legal レンジ)ことを確認します。
- SPG Bit Depth パターンを使って、10 ビット処理が維持されていることを確認します。
- SPG Exposure Stops パターンでテストして、線形の照明応答を確認します。
- イメージングチェーンの問題を解決した後、キャリブレーションパッチを再撮影します。
7. Macbeth Chart
Section titled “7. Macbeth Chart”Macbeth ボタンは、メインキャンバスを切り替えて、キャプチャーした Macbeth ColourChecker 参照画像を表示します。
表示内容:
- 分析処理中にキャプチャーされた実際のキャリブレーションターゲット画像。
- 標準的な Macbeth ColourChecker レイアウトで配置された 24 個のカラーパッチ。
- カラー精度測定に使用される参照パッチ。
結果の解釈:
- クリックして、Macbeth チャートビューとグラフビューを切り替えます。
- 分析中にカラーパッチ検出が正しく機能したことを確認します。
- キャリブレーションパッチが適切にキャプチャーされたことを視覚的に確認します。
- Macbeth チャートが表示されない場合、検出アルゴリズムが失敗した可能性がありますが、これはキャリブレーションの成功を妨げません。主要なキャリブレーションパッチは引き続き正しく分析されます。
8. Analyse
Section titled “8. Analyse”これは Main タブ の Analyse ボタンと同じボタンです。クリックすると Main タブに切り替わり、分析処理を開始します。
9. Calibrate
Section titled “9. Calibrate”これは Main タブ の Calibrate ボタンと同じボタンです。クリックすると Main タブに切り替わり、キャリブレーション処理を開始します。
10. Verify
Section titled “10. Verify”キャリブレーションが完了し、Designer の OCIO 設定が事後キャリブレーション設定に更新されると、このボタンでキャリブレーション結果を検証できます。このボタンは、ターゲットディスプレイで補正済み output transform を使ってキャリブレーションパッチをキャプチャーし、それらに対して分析を実行します。Verify をクリックすると、プラグインは次を行います。
- ターゲットディスプレイの画像シーケンスキャプチャーを開始します。
- キャプチャーしたすべての画像を Designer からダウンロードします。ダウンロードされた画像は次の場所に保存されます。
Documents/d3plugins/openvpcal/assets/<project>/<camera__display>/capture
- ダウンロードしたすべての EXR(ACES2065-1)画像を、プレビュー用に PNG(sRGB)に変換します。次の場所に保存されます。
Documents/d3plugins/colourcal/assets/<project>/<camera__display>/preview
- すべてのプレビュー画像をフロントエンドに読み込みます。
- Analyse ボタンと同様に、キャプチャーした画像に対して分析を実行します。
11. Designer Control
Section titled “11. Designer Control”このセクションでは、Designer プロジェクトからどのキャリブレーションデータを表示するかを選択できます。
コントロール:
- MRSet: 分析したいキャリブレーションデータを含む Mixed Reality Set を選択します。
- Camera: 表示するカメラのキャリブレーション結果を選択します。
- Display: 分析する LED ディスプレイのキャリブレーションを選択します。
動作:
- いずれかのドロップダウンを変更すると、選択したキャリブレーションデータですべてのグラフが自動的に更新されます。
- Analyse または Calibrate 処理が完了したデータが存在する必要があります。
- 異なるカメラ/ディスプレイの組み合わせでキャリブレーション結果を比較できます。
12. Analysis Graph Control
Section titled “12. Analysis Graph Control”このセクションは、すべてのグラフにわたるデータ系列とチャンネルの表示を制御し、キャリブレーションの特定の側面に集中できるようにします。
- Show Pre-Calibration
- キャリブレーション前に取得した測定値を表示します。
- 破線と太いバー(半透明)で表示されます。
- 初期のディスプレイ状態とキャリブレーションの出発点を理解するために使用します。
- Show Post-Calibration
- キャリブレーション後に取得した測定値を表示します。
- 実線と細いバー(より不透明)で表示されます。
- キャリブレーションの改善と最終精度を検証するために使用します。
- Show Target
- ターゲットカラースペースの仕様を表示します。
- 理想的な参照目標(例: Rec.2020、P3、カスタムガモット)を示します。
- 実際のパフォーマンスをキャリブレーション目標と比較するために使用します。
- Show Macbeth
- Macbeth ColourChecker のサンプルポイントを表示します。
- CIE 1931 色度図(項目 5)でのみ表示されます。
- カラー参照パッチの測定位置を示します。
- Show Red
- EOTF Analysis Graph(項目 3)の赤チャンネルデータの表示を切り替えます。
- Show Green
- EOTF Analysis Graph(項目 3)の緑チャンネルデータの表示を切り替えます。
- Show Blue
- EOTF Analysis Graph(項目 3)の青チャンネルデータの表示を切り替えます。
Workflow Guide
Section titled “Workflow Guide”キャリブレーション結果を効果的に分析するには、次のワークフローに従ってください。
- データソースを選択: Designer Control(7)を使って MRSet、Camera、Display を選択します。
- 概要を確認: 4 つのグラフのサムネイル(2〜5)を確認して素早く評価します。
- 詳細を掘り下げる: 任意のサムネイルをクリックして、メインキャンバス(1)でビューを拡大し、詳細に検査します。
- 結果を比較: 表示トグル(8)を使って、キャリブレーション前、キャリブレーション後、ターゲットのデータを比較します。
- 詳細をズーム: スクロールしてズーム、ドラッグしてパンし、特定の領域を詳細に検査します。
- パッチ検出を確認: Macbeth ボタン(6)をクリックして、カラーパッチ検出が正しく機能したことを確認します。
- 所見を解釈: 以下のガイドラインを使ってキャリブレーション品質を判断します。
Interpreting Calibration Results
Section titled “Interpreting Calibration Results”良好なキャリブレーションの指標:
- Max Distance: すべての RGB チャンネルでバーがゼロ付近。
- EOTF: 線が対角参照線に近く沿っている。
- White Point: キャリブレーション後のマーカーがターゲットマーカーに非常に近い。
- Gamut: キャリブレーション後の三角形がターゲット三角形と密接に重なる。
よくある問題とその意味:
- 不均一な Max Distance バー: 1 つ以上のチャンネルにキャリブレーション誤差があります。
- 特定のチャンネルに注意が必要かを確認します。
- そのチャンネルの LED 劣化やハードウェアの問題を示すことがあります。
- 対角線から離れた曲線の EOTF: ガンマやトーン応答の問題。
- ディスプレイが明るさを線形に再現していません。
- EOTF 補正設定の調整が必要なことがあります。
- 分離したホワイトポイント: 色温度の不一致。
- ホワイトバランスの補正が必要です。
- カメラのホワイトバランス設定を確認します。
- 小さなガモット三角形: LED ハードウェアがターゲットプライマリに到達できません。
- LED パネルの物理的な制限。
- ターゲットガモットがハードウェアで達成可能かを検討します。
再キャリブレーションのタイミング:
- キャリブレーション後の誤差が、キャリブレーション前に対して依然として大きい。
- キャリブレーション前後の測定値の間に大きな視覚的差異が残る。
- キャリブレーション後もホワイトポイントがターゲットから遠い。
- キャリブレーションのフィードバックメッセージが問題や警告を示唆している。
- LED ウォールのハードウェアが変更または修理された。
許容範囲:
- ハードウェアの制約により、完全からの小さな偏差は正常です。
- キャリブレーション後は、キャリブレーション前より大幅な改善を示すはずです。
- ターゲットとの一致は LED ハードウェアの能力に依存します。
- 具体的な推奨事項については、Main タブのキャリブレーションフィードバックメッセージを参照してください。
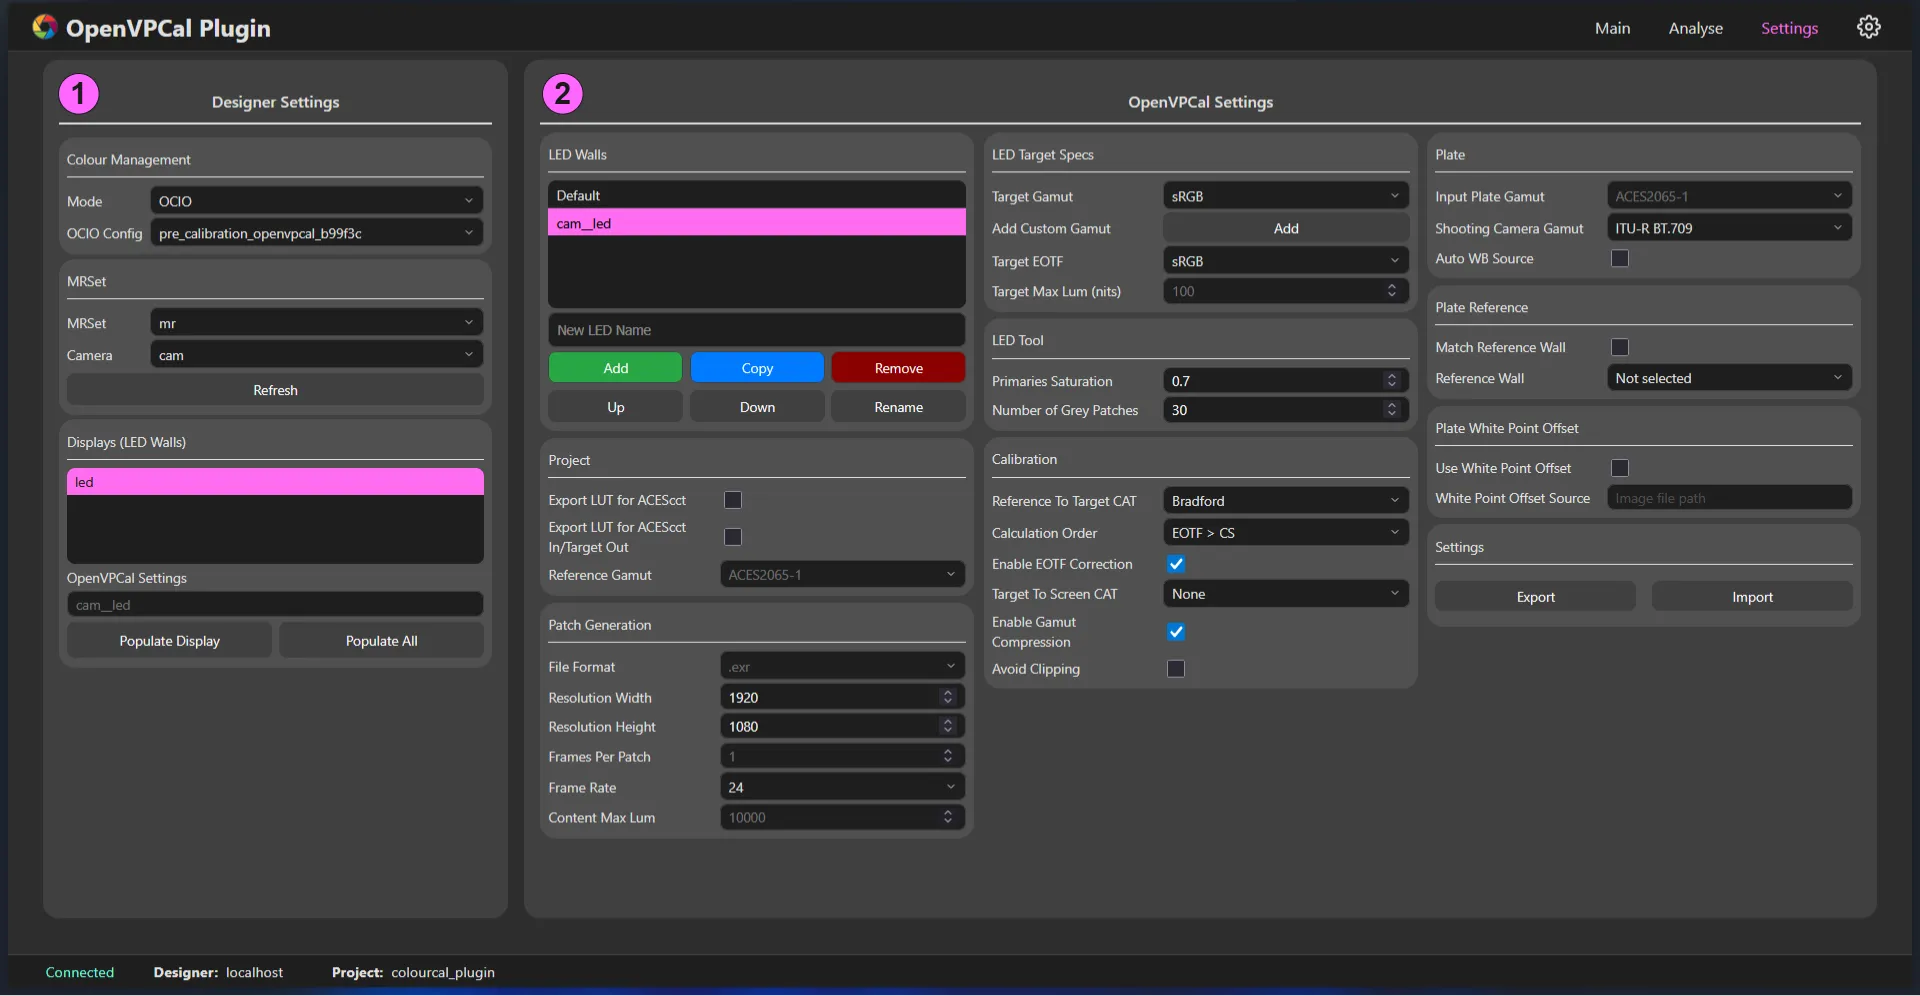
Settings Tab(Settings タブ)
Section titled “Settings Tab(Settings タブ)”Settings タブには、カラーキャリブレーション処理のすべての構成オプションが含まれます。これらの設定は、キャリブレーションパッチの生成方法、分析の実行方法、最終的なキャリブレーションの計算・適用方法を制御します。
Settings タブの要素
Section titled “Settings タブの要素”1. Designer Settings
Section titled “1. Designer Settings”Designer Settings セクションは、OpenVPCal を Designer のカラーマネジメントシステムと統合し、Mixed Reality Set 内でキャリブレーションを適用できるようにします。
Colour Management Settings
Section titled “Colour Management Settings”キャリブレーションの基盤として使用される OCIO カラーマネジメントパイプラインを構成します。
| Colour Management | 説明 |
|---|---|
| Mode | Designer プロジェクトのカラーマネジメントモードを選択します。 |
| OCIO Config | キャリブレーション結果を含む新しい設定を作成するためのベースとして現在選択されている OCIO config。 |
Mixed Reality Set Configuration
Section titled “Mixed Reality Set Configuration”キャリブレーションに使用する MR Set とカメラを選択・構成します。
| MR Set | 説明 |
|---|---|
| MR Set | 現在選択されている MR Set。 |
| Camera | 現在の MR Set で選択されているターゲット Camera。 |
LED Display Management
Section titled “LED Display Management”MR Set に割り当てられた LED ディスプレイと、それに関連する OpenVPCal 設定を管理します。
| Displays(LED Walls) | 説明 |
|---|---|
| Displays | 現在の MR Set に割り当てられたディスプレイのリスト。 |
| OpenVPCal Settings | 選択されたカメラ/ディスプレイのペア(キャリブレーションアセット)に関連付けられた OpenVPCal 設定。 |
| Populate Display | 選択したディスプレイの OpenVPCal 設定を作成します。 |
| Populate All | リストされたすべてのディスプレイの OpenVPCal 設定を作成します。 |
2. OpenVPCal Settings
Section titled “2. OpenVPCal Settings”OpenVPCal Settings は、特定のカメラとディスプレイの組み合わせのキャリブレーションデータを収集します。各設定セットは、Designer のタイムラインのコンテンツに適用できる固有のキャリブレーションを生成するために使用されます。
LED Wall Configuration and Management
Section titled “LED Wall Configuration and Management”キャリブレーションワークフロー向けに、さまざまな LED ウォール構成を作成・整理・管理します。
| LED Walls | 説明 |
|---|---|
| New LED Name | 新しい LED ウォール構成の名前を入力するテキストフィールド。 |
| Add | 「New LED Name」フィールドで指定した名前で、新しい OpenVPCal 設定セットを作成します。 |
| Copy | 現在選択されている LED ウォール構成を複製し、同じ設定をすべて持つコピーを作成します。 |
| Remove | 現在選択されている LED ウォール構成と、それに関連するすべての OpenVPCal 設定を削除します。 |
| Up | 現在選択されている LED ウォール構成を、リストの順序で 1 つ上に移動します。 |
| Down | 現在選択されている LED ウォール構成を、リストの順序で 1 つ下に移動します。 |
| Rename | 現在選択されている LED ウォール構成の名前を変更できます。 |
Project Settings
Section titled “Project Settings”キャリブレーションデータの処理・エクスポート方法に影響するグローバルなプロジェクト設定。
| Project | 説明 |
|---|---|
| Export LUT for ACEScct | キャリブレーション LUT のエクスポートを変更し、LUT が ACEScct 入力を期待して、補正済みの ACEScct 出力を生成するようにします。ユーザーは ACEScct からターゲットへのカラースペース変換と EOTF トランスフォームを個別に適用する必要があります。 |
| Export LUT for ACEScct In/Target Out | キャリブレーション LUT のエクスポートを変更し、LUT が ACEScct 入力を期待して、補正済みのターゲット出力(カラースペースと EOTF トランスフォームの両方をターゲットに適用)を生成するようにします。 |
| Reference Gamut | 異なる入力とターゲットのカラースペース間のすべてのカラー変換とキャリブレーション計算の共通の計算基盤として使用されるカラースペース。通常は ACES-2065-1。 |
Calibration Patch Generation
Section titled “Calibration Patch Generation”カラーキャリブレーションパッチとテストパターンを生成するための技術仕様を構成します。
| Patch Generation | 説明 |
|---|---|
| File Format | エクスポート用のファイル形式。EXR を選択すると、パッチは線形(例: Linear Rec 2020)で、1=100 nits となるようにスケールされてエクスポートされます。それ以外の場合、パッチはターゲットスペースと EOTF(例: ST 2084 - Rec 2020)でエクスポートされます。 |
| Resolution Width | エクスポートされるパッチの幅の解像度。 |
| Resolution Height | エクスポートされるパッチの高さの解像度。 |
| Frames Per Patch | ツールがエクスポートするパッチごとのフレーム数。 |
| Frame Rate | 撮影カメラのフレームレート。特定の SPG パターンシーケンスで使用されます。 |
| Content Max Lum | コンテンツの最大輝度。指定した最大値を LED ウォールのピーク輝度に緩やかにロールオフする 3 種類のクリエイティブロールオフを生成するために使用されます。既定値は PQ の最大値である 10,000 nits です。 |
LED Display Target Specifications
Section titled “LED Display Target Specifications”LED ウォールが再現すべきターゲットのカラースペース、明るさ、ガンマの特性を定義します。
| LED Target Specs | 説明 |
|---|---|
| Target Gamut | キャリブレーションのターゲットガモット。定義済みの標準ガモット(sRGB、P3、Rec.2020)から選択するか、LED ウォールのプライマリに一致するカスタムのものを選択します。 |
| Add Custom Gamut | カスタムガモット名とその CIE 1931 x,y プライマリおよびホワイトポイント座標を入力して、キャリブレーション用の新しいカスタムガモットを追加できるポップアップウィジェット。 |
| Target EOTF | LED パネルのターゲット EOTF を選択します。ST2084 とパワーガンマ(sRGB/BT1886)を切り替えると、MaxLum が自動的にリセットされることに注意してください。 |
| Target Max Lum (nits) | コンテンツのピーク輝度を選択します(EOTF が ST2084 の場合のみ利用可能)。 |
Colour Patch Configuration
Section titled “Colour Patch Configuration”キャリブレーション処理で使用するカラーパッチの特性を微調整します。
| LED Tool | 説明 |
|---|---|
| Primaries Saturation | カラープライマリの彩度の強さ(既定値 0.7)。 |
| Number of Grey Patches | 生成・分析されるグレーステップの数(既定値 30)。 |
Calibration Settings
Section titled “Calibration Settings”キャリブレーショントランスフォームの計算・適用方法を制御します。
| Calibration | 説明 |
|---|---|
| Reference To Target CAT | 標準の Chromatic Adaptation Transform のリストから選択するか、Reference to Target の 3x3 マトリックスに NONE を選択します(既定値 Bradford)。 |
| Calculation Order | キャリブレーショントランスフォームの演算順序を編集します。 |
| Enable EOTF Correction | チェックすると EOTF 補正を有効にします。 |
| Target To Screen CAT | 標準の Chromatic Adaptation Transform のリストから選択するか、Calibration マトリックスに NONE を選択します。既定では None が設定されています。 |
| Enable Gamut Compression | チェックするとガモット圧縮を有効にします。 |
| Avoid Clipping | チェックすると、ハイライトのクリッピングを避けるためにキャリブレーショントランスフォーム全体をスケールします(既定でオン)。 |
Camera Plate Configuration
Section titled “Camera Plate Configuration”正確なキャリブレーション処理のため、カメラのキャプチャー映像のカラースペース特性を指定します。
| Plate | 説明 |
|---|---|
| Input Plate Gamut | 前処理されたカメラプレートシーケンスの入力カラースペース(既定値 ACES-2065-1)。 |
| Shooting Camera Gamut | キャリブレーションに使用されたカメラのネイティブカラースペース。 |
Reference Calibration Settings
Section titled “Reference Calibration Settings”自動ホワイトバランスと、複数の LED ウォールセットアップ間の相互参照を構成します。
| Plate Reference | 説明 |
|---|---|
| Auto WB Source | 有効にすると、分析とキャリブレーションを実行する前に入力プレートのホワイトバランスが調整されます。 |
| Match Reference Wall | チェックすると、選択した LED ウォールが選択した参照ウォールに一致するように調整されます。 |
White Point Correction
Section titled “White Point Correction”参照画像を使ってキャプチャープレートのホワイトポイントを調整し、キャリブレーション精度を向上させます。
| Plate White Point Offset | 説明 |
|---|---|
| Use White Point Offset | チェックすると、分析とキャリブレーションを実行する前に、プレートの元のホワイトポイントが指定したファイルの測定ホワイトポイントに向けてシフトされます。 |
| White Point Offset Source | ホワイトポイントオフセットソースとなる画像ファイルへのパス。 |